- Details

NASA Earth to Sky Team Northeast Ohio Climate HeroesTeam Northeast Ohio Climate Heroes presents:
Flowing Forward: Climate, Health and Community in the Cuyahoga River Watershed
August 25 - 28, 2026
Visiting sites in Cleveland, Akron, and Cuyahoga Valley National Park
How can our communities work together to create healthier environments and stronger, more sustainable futures for everyone in a changing world?
Applications are now open, until July 15! Join your colleagues in a supportive community of practice to learn about the science of climate change, the social determinants of health, and the unifying role of water, while sharing best practices in science communication and community engagement.
Flowing Forward: Climate, Health and Community in the Cuyahoga River Watershed provides you with a foundation in climate science with an emphasis on the connection between global and local processes and on climate impacts in this region. Participants will discuss and practice proven methods for successful climate communication and connect with the growing Earth to Sky community of practice – over 2400 communicators and scientists from a variety of organizations improving and sharing their expertise on this topic. You will leave the course armed with knowledge about cutting-edge climate science and a plan for bringing the climate story to your visitors in engaging and inspiring ways.
- Offered through the NASA Earth to Sky (ETS) interagency collaboration
- No Tuition Fee
- This course is intended for local participants commuting from home. Any travel expenses are the responsibility of participants and/or their institutions. Free lodging is available if needed, contact the team to request it.
Course Objectives
Upon completion of the course, participants will be able to:
-
Design and execute an action plan to collaboratively produce a climate change education, outreach, and/or interpretative product/program.
-
Engage with the Earth to Sky community, both regionally and nationally, to exchange ideas and expertise and to facilitate implementation of their action plan.
-
Using an Earth Systems Science approach, describe at least one connection between global, regional, and local Earth processes affecting climate in their region.
-
Describe the significance and implications of environmental change in their region to society and natural systems.
-
Describe how global climate-related changes in ecosystems, economies, or society may impact their region.
-
Choose suitable communication strategies for a particular audience based on available audience research and engagement with their audience.
-
Use engaging, audience-appropriate communication techniques, such as metaphor, analogy, visual imagery, storytelling, dialogic questions, or co-creation of knowledge in their product/program.
-
Select relevant, audience-appropriate NASA science content and/or educational/visual elements to use in their product/program.
-
Identify and access credible sources of accurate and timely climate change science relevant to their region/site.
Course Structure
![]() This course emphasizes experiential learning. It starts with a few distance-learning components that participants are required to complete and an in-person keynote kickoff on the evening of August 25 (dinner provided) prior to attending three days of face-to-face sessions (August 26 - 28) in the Cleveland-Akron area. Participants are expected to be present and fully participate in all of the face-to-face sessions. Approximately four months later, a one-hour webinar will be held for participants to share progress and challenges and receive feedback/assistance in executing their action plans. The collegial atmosphere of this course provides participants with many opportunities to engage with scientists, communication practitioners, and colleagues in collaborative learning.
This course emphasizes experiential learning. It starts with a few distance-learning components that participants are required to complete and an in-person keynote kickoff on the evening of August 25 (dinner provided) prior to attending three days of face-to-face sessions (August 26 - 28) in the Cleveland-Akron area. Participants are expected to be present and fully participate in all of the face-to-face sessions. Approximately four months later, a one-hour webinar will be held for participants to share progress and challenges and receive feedback/assistance in executing their action plans. The collegial atmosphere of this course provides participants with many opportunities to engage with scientists, communication practitioners, and colleagues in collaborative learning.
Pre-Work
These pre-work assignments will be referred to and used during the face-to-face sessions.
Face-to-Face Sessions in the Cleveland-Akron area
- Climate scientists will present climate science in both global and regional contexts followed by discussion sessions to apply that content in participants’ work setting.
- NASA data resources relevant to Northeast Ohio will be demonstrated.
- Field trips to areas of urban sustainability initiatives will serve as case studies illustrating climate science and a model for climate communication and meaningful co-creation with local communities.
- Dedicated time to work with colleagues, coaches, and experienced mentors as part of a regional community of practice to create an action plan for developing a product or program applying course content for use in their site or organization. Participants are encouraged to reach out to internal and external communities as they execute these action plans.
- Opportunities to learn from and talk with local changemakers, medical experts, and world-class climate scientists.
- Learn climate change communication best practices through presentations from experienced interpreters.
- Practice selected communication methodology appropriate to participants’ work settings.
About Earth to Sky
Earth to Sky (ETS) is an ongoing and expanding collaboration between NASA and the National Park Service (NPS) that enables and encourages interpreters, educators, and science communicators to access and use relevant science, data, and educational and outreach products in their work. Since 2004, the partnership has conducted many professional development events on Earth and space science topics, including climate change. https://www.earthtosky.org
Who should attend?
Informal educators and environmental educators from the private or public sector interested in collaborating with others to communicate about public health, community engagement, and climate change.
Requirements
In order to attend this course, participants should have prior experience in communications (i.e., interpretation, environmental education, outreach, and/or public affairs). Individuals must complete the Application Form illustrating their interest and experience in climate change communications. Experience or knowledge of climate science is not a prerequisite.
This workshop happens across different locations over the evening of August 25 and then the days of August 26 - 28. Participants are expected to be able to provide their own transportation to the course location at the start of each day (respectively in Cuyahoga Valley National Park, Cleveland, and Akron). Transport will be provided within each day.
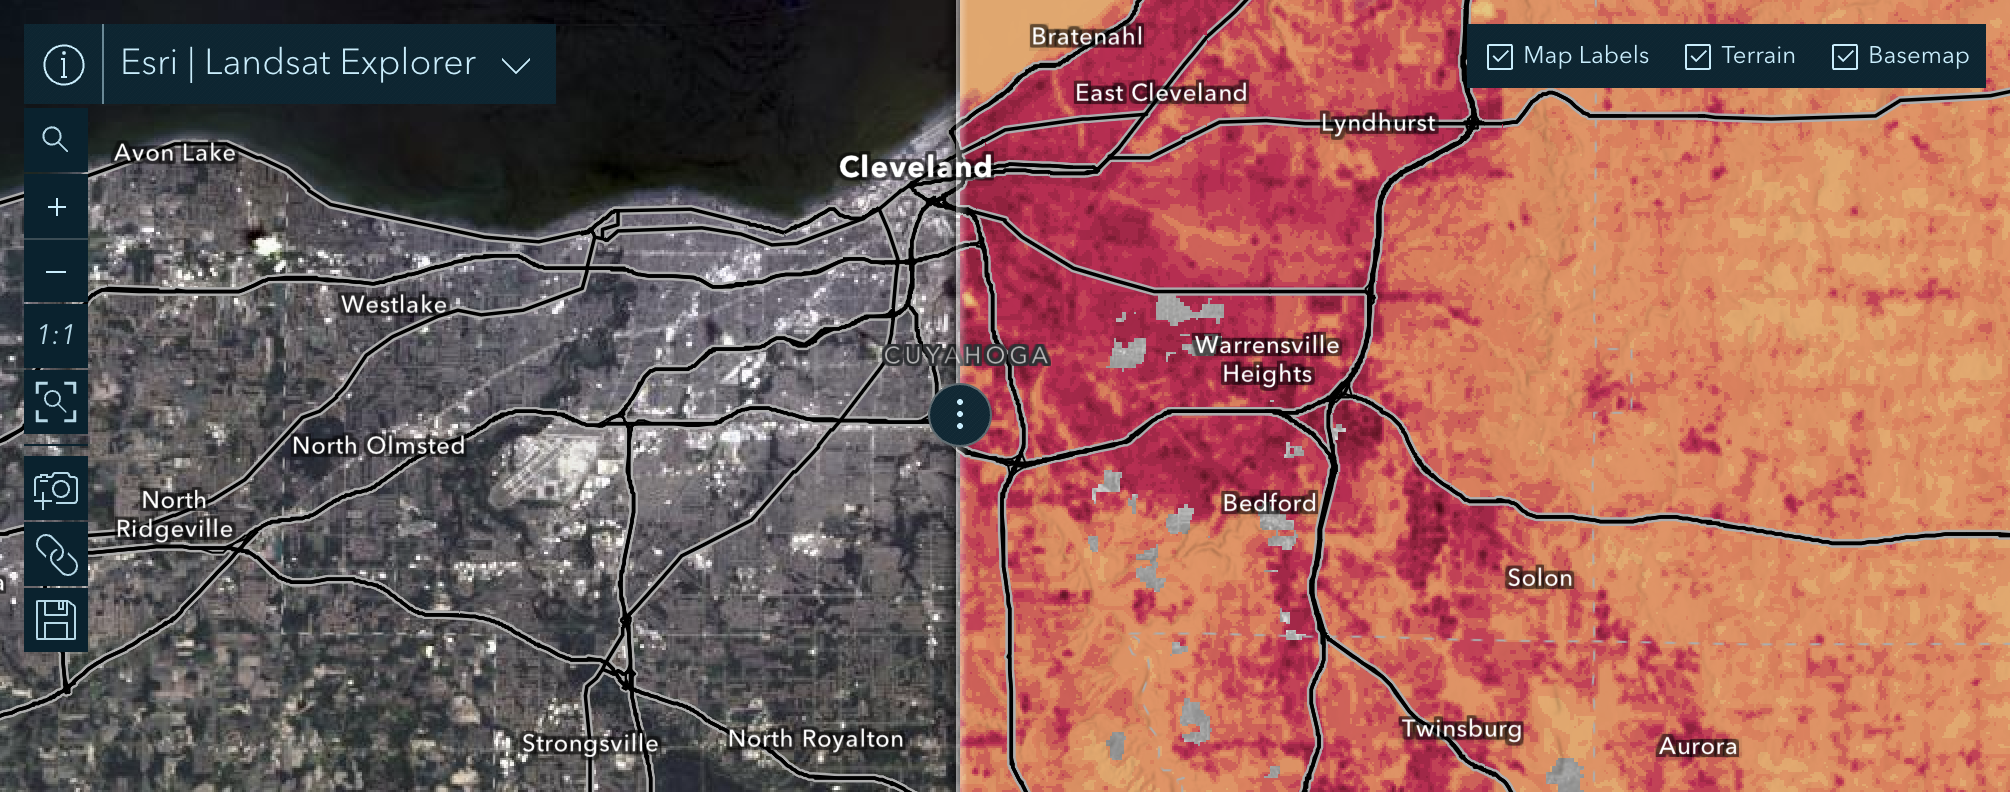
NASA Earth data can bring space-based nuance to your education and interpretation programs. Click the image to explore a zoomable map of the Cleveland area in July 2025, and swipe back and forth between natural color and surface temperature data. The surface temperature data shows hotter areas in deep red, and cooler areas such as the lake, rivers, and forests in pale orange.
Expectations of Participants
- Complete ~4 hours of preliminary assignments outlined above in preparation for the face-to-face sessions.
- Be present and fully participate at the evening keynote kickoff and all three days of face-to-face sessions.
- Create an Action Plan for developing an interpretive, educational, or outreach product or program applying course content.
- Participate in post-course reporting and evaluations, including a one-hour follow-up webinar with fellow course participants.
Selection Process
The course planning team will carefully review and make selections based on information provided in your Application Form. The maximum class size is 25. Those not selected during the first round will be placed on a waitlist to backfill any cancellations.
How to Apply
Apply for the course via this Google Form!
Applications close on July 15, 2026.
Cost
The course is tuition-free. Travel expenses are the responsibility of participants and/or their institutions.
Questions?
Contact us at This email address is being protected from spambots. You need JavaScript enabled to view it.
- Details

NASA / Earth to Sky Academy created in Your Name in Landsat
Applications are open now! Applications close June 30th, 2026.
The Earth to Sky (ETS) Virtual Academy is intended to elevate place-based Earth science interpretation and informal education using NASA science and resources. It is designed for teams of experienced interpreters, informal educators, and science communicators who have a commitment to furthering place-based climate literacy for their peers within their region. During the Academy, selected teams will receive training on how to conduct two Earth to Sky science interpretation/education courses using the ETS methodology, to nurture their own regional community of practice, and to participate in the Earth to Sky community of practice.
The Academy emphasizes experiential, collaborative learning in a collegial environment. Teams will receive the Earth to Sky methodology, NASA resources, and guidance needed to host two Earth to Sky regional courses, along with ongoing support to sustain their regional community of practice.
We will be taking the Academy virtual this year for the first time. We are hopeful that this may allow groups of dedicated interpreters and informal educators to apply that may not have been able to in the past.
Earth to Sky’s Virtual Academy
When: From October 27-29 & November 3-5, 2026. Each day requires a six-hour commitment: four hours of live training and two hours of teamwork.
Where: Online
Why: Interpreters and informal educators in your region need training on science communication, and you feel ready to be part of a team that will provide that training.
Who: Participants apply as teams of 3-5 collaborators who have self-selected their geographical region and their primary audience. Your team should reflects a diverse range of backgrounds and expertise in Earth and climate science communication and training. We prefer that the team includes at least one alum of a previous Earth to Sky course. However, teams without an alum will have an opportunity to enroll at least one team member in a separate Earth to Sky course to gain that alum experience.
Cost: Tuition Free
How:
- Gain your supervisor's approval.
- Create a team, view the informational webinar below, and apply!
- Complete the ~11 hours of preparatory work prior to the Academy, including an in-person meetup with your team. Funding will be provided to facilitate your meetup.
- Join the other new teams for Earth to Sky’s Virtual Academy. The Academy: Held online three days a week for two weeks. Each day requires a six-hour commitment: four hours of live training and two hours of teamwork.
- Post-Course: Four followup sessions with all regional leaders in attendance.
Existing teams which have reformed with new members may re-apply to attend the Academy. This may be desirable if the team has significant turnover or new goals which could be catalyzed by returning to the Academy.
- Details
Enhance Your Story with NASA Data - Chesapeake Region
 Welcome, NAI Region 2!
This resource list has been curated for you as part of the 2026 “250 Forward Together” NAI Region 2 Virtual Spring Workshop.
Presentation Slides (large file size due to embedded animations)
Community
- Register for NASA Earth to Sky and sign up for our mailing lists to join a global community of interpreters using tools like NASA science in their programs and products: https://earthtosky.org/join
- Register for our upcoming virtual events and webinars, Speaking of Space, Science in Your Pocket, and Community Conversations
- Hot off the press! Earth to Sky now has materials to help you run your trainings for seasonals.
- Get ready to interpret the night sky: https://earthtosky.org/related-news/485-bring-nasa-space-science-to-your-seasonal-training.html
- Prepare your staff for climate change interpretation: https://earthtosky.org/related-news/486-nasa-earth-science-resources-for-seasonal-training.html
- Ask us for help: This email address is being protected from spambots. You need JavaScript enabled to view it.
Science Learning Resources
- NASAʻs Earth Observation Data Basics
- NASAʻs Earth Observing Fleet
- NASAʻs Earth System Observatory
- Articles: NASAʻs Earth Observatory
Interactive Data Tools
- Your Name in Landsat
- Landsat images of the Chesapeake Bay
- Earth to Sky tutorials to make Landsat mosaic maps:
- Change Over Time: Google Timelapse
- Color a Pixel tool
- Pre-generated versions including the Chesapeake Bay
- Go deeper: the ESRI Landsat Explorer gives you lots of control over how to display NASA/USGS Landsat data

- This is a swipe comparison of Blackwater Falls State Park, WV, in splendid fall color last November vs covered in snow in early February

- This is a swipe comparison of Philadelphia from July 4, 2025, comparing natural color to surface temperature.
- This tool takes more of a learning curve. Key points are to set your acceptable level of cloud coverage (eg 30%), identify dates when there is a suitable Landsat "scene" (small filled in boxes), and select what kind of data (like natural color or surface temperature) from the menu to the right.
- Sea Level Rise:

- Details
This selection of videos can be used to introduce communicating climate change into a seasonal or developmental training setting for early to mid-career interpreters and place-based informal science educators. Each video, while worth a full watch has also been time coded for brevity and use in a limited training session. Along with the time codes we have provided a list of discussion topics, questions, and techniques to accompany each clip.
Topics Covered:
- The basic science of climate change thru the carbon cycle.
- How we know that the current climate crisis is caused by humans.
- Wise practices for communication of climate change.
- How climate science can provide solutions.
- Why hope is so important in climate change messaging.
The Carbon Crisis in 90 Seconds - Presented by Dr. Peter Griffith, NASA
For a deeper dive watch Dr. Griffith's full presentation on the carbon cycle.
Carbon - Watch the full video - it's only 90 seconds!
We often take the term “climate change” for granted. But do we understand the crisis at its most basic level?
Group Discussion Prior to Viewing
- Ask your participants to jot down in as few words as possible a description of what climate change is. You can even be creative and make this an interpretive writing exercise: limit their characters, create a haiku, etc.
Group Discussion After Viewing
- How did they do? Popcorn some answers, look for revelations or agreements with how Dr. Griffith presented the metaphor.
- Do your participants feel comfortable explaining the basics of GCC to an audience in under a minute?
Deeper dive?
- Watch Dr. Griffith’s full presentation, “Carbon, a love story”
- Discover more with Earth to Sky's Earth Sysytems training module: https://earthtosky.org/professional-development/earth-as-a-system.html
- Check out our resources page for more NASA Earth Science content! https://earthtosky.org/library/recommended-resources.html
Climate Change: Past, Present, and Future - Presented by Dr. Kate Marvel, NASA
We Understand Why - Start at 0:50-10:00
A concern many interpreters have is how to engage with climate deniers. Especially those who seem to have done some research into the most common/popular arguments that there are non-human causes for the rise in observed temperatures.
Group Discussion Before Viewing
- Poll your participants. How do they feel about engaging with climate deniers? What are their expectations/fears/questions? Do any of them have stories to share about past experiences?
Group Discussion After Viewing
- Did the use of the graphs make the anthropogenic claim clearer?
- How might these visuals be deployed in the field? In a program/rove/as support for an engagement with a climate denier?
Speaking of Climate Change - Presented by Todd Cullings, NPS
Snowmelt and the 7 Climate Change Communicators - Start at 53:49-1:32:04
How do we do it? We want to talk about the impacts of climate change on our resource. We might be mandated to talk about it in our programs or roves. We may even have an audience eager to hear about it. But we just don’t know where to start. Ranger Todd breaks down the basics of climate change communications wise practices in a fun and memorable way using some familiar faces from a Disney classic.
This is a lengthy clip but one that is perfect for group work.
- Divide up your participants into 7 groups and assign one of the “7 communicators” to each. Have them watch their assigned clip, summarize the segment into a few sentences or bullet points, reflect on their reaction to it, and present to the larger group.
Group Discussion After Viewing & Report Outs
- Vote with your feet. Post images of each communicator around your training space and ask your participants to move to the dwarf that: Which of the seven most resonated with you? Which are you most eager to watch on your own? Which do you think you would struggle the most to implement? Which do you think will be most effective here at our resource?
- Popcorn answer from their seat. Do you already practice any of these techniques or utilize these tips? How has that worked for you in the past? Did this presentation help put that experience into focus and give a “name” to your practice?
- Roleplay. Pair share some ideas and examples of one of the communicators in practice. Give your participants a few minutes to jot down some ideas to workshop with a partner and give it a try through roleplay.
Timestamps for the Seven Climate Change Communicators
- 54:26 Lane
- 57:12 Micro Messenger
- 1:02:54 Hopeful
- 1:07:02 Doubtful
- 1:11:57 Big R
- 1:18:12 Wordy
- 1:27:52 Doc Norm
Deeper dive?
- Check out Earth to Sky's, Climate Communcation Starter Kit: https://earthtosky.org/library/climate-communication-starter-kit.html
NASA Earth: Our Role in Climate Resilience - Presented by Ayia Lindquist, NASA
Science Supported Decision Making - Start at 11:38-22:54
How can we be effective moving forward? What changes will really make a difference? Productive solutions-based messaging can help provide hope, confidence, and inspire meaningful action in our audiences. Ayia provides real-work examples of how NASA science has influenced and been implemented in local decision making to help communities employ solutions to mitigate the impacts of our changing climate.
Group Discussion After Viewing
- Which of the examples shared were most compelling to you?
- What are the common threads in all these examples? Are there any overlaps with our local resource/community/region?
- How might you employ examples from elsewhere into your messaging and connect it to our resource and back home where your audience is from?
Exploring the Science of Emotion: Applying Insights from Behavioral Science - Presented by Heidi Zamzow, ETS Community
Hope and Human Behavior - Start at 27:06-36:52
If our audiences walk away from our programs informed but uninspired, or worse depressed with the current climate situation then what was the point of our presentation? How do we provoke the desired action we hope our audiences will take? How do we help them maintain the inspiration our site and their visit provides to them? Heidi talks about the power of hope to inspire, sustain, and maintain us for the work ahead.
Group Discussion After Viewing
This is an excellent time for some quiet reflection and journaling for your participants.
- How do you find the motivation to continue this work, day after day?
- What gives you hope and sustains you when communicating about the impacts of climate change?
- What are some ideas you have for integrating a message of hope into your programming?
- Details
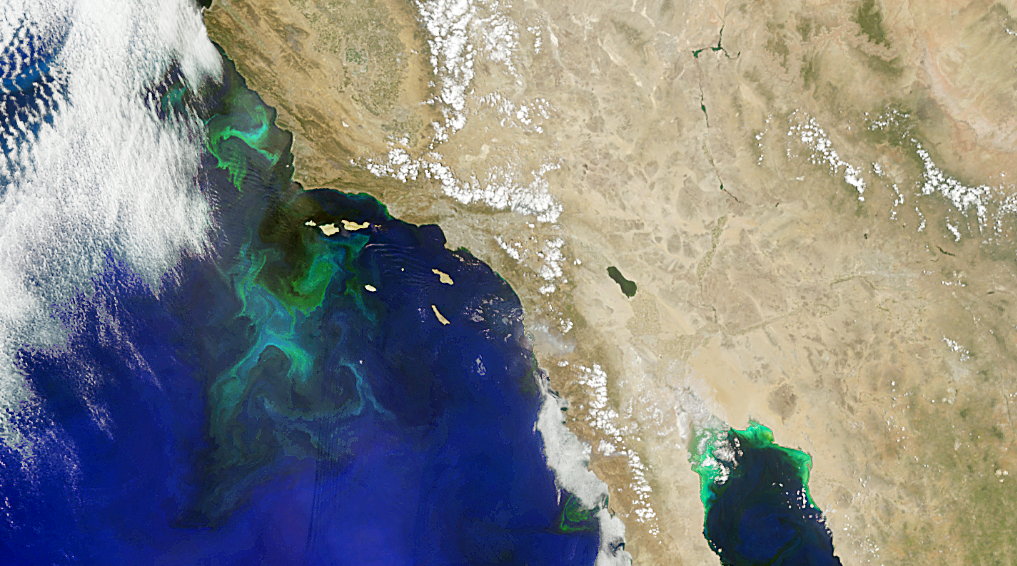
An image of phytoplankton communities off the coast of southern California from the NASA PACE mission.
The story of oceans is the story of life. Oceans define our home planet, covering the majority of Earth’s surface and driving the water cycle that dominates our land and atmosphere. Data collected by NASA’s Earth-observing instruments help scientists understand how Earth’s ocean supports a vast diversity of life and the role it plays in influencing global temperature, weather patterns, climate, and food supply.
This Earth to Sky Virtual Course will explore the story of our oceans. This is a professional development opportunity for place-based interpreters and informal educators.
What is an Earth to Sky Course?
Our workshops provide you with a fantastic opportunity to connect with NASA ocean science, scientists, and data and then synthesize this information with cutting edge science interpretation strategies.
In addition to class time, you will work on your own each week, and meet with your coach in a small group for support. During the course, you will develop an action plan for a science interpretation product or program that you can implement at your home site.
We ask that you bring your own experience, expertise, and ocean story with you. An Earth to Sky course nurtures the robust sharing of ideas, experiences, and aspirations for science interpretation. We invite all of our participants to engage fully in the course and our community of practice.
Details:
- Pre-assignments will take approximately 4 hours to complete.
- This course will be completed over three weeks.
- Registration is free.
- The course will be hosted on Microsoft Teams. An account is not required to participate.
Schedule:
- Course dates: April 21st - May 7th, 2026
- The course will be hosted online via Teams and meet for 2.5 hours every Tuesday and Thursday starting at 5 pm EDT / 2 pm PDT / 11 am HST /7 am ChST. In addition, there will be required small-group and individual off-line work on Wednesday of each week (approximately 1.5-2 hours, start times to be determined by each group).
Apply HERE!
All applicants must register for our community before submitting an application.
Questions or comments can be directed to the course coordinator, This email address is being protected from spambots. You need JavaScript enabled to view it..
We hope to see you online soon!
“How inappropriate to call this planet Earth when it is clearly Ocean” Arthur C. Clarke, Nature 8 March 1990
- Details

When you think about national park and public land astronomy programs, you might picture remote locations far from city lights. But a recent NASA Earth to Sky training, funded by NASA’s Science Activation Program, challenges that assumption, demonstrating how urban parks, wildlife refuges, museums, and green spaces can be incredible venues for connecting communities with space science. Programs facilitated in urban spaces can reach people where they already live, work, and recreate. This creates opportunities for ongoing engagement as urban astronomy program participants can discover that the skies above their neighborhoods hold the same wonders as remote locations.
Learn more about the outcomes of this course in NASA's Science Activation story.
- Details

NASA’s Earth to Sky Idaho Presents:
ADAPT! A Climate Action Workshop for Educators
October 22–24, 2025 | Boise, Idaho
The NASA Earth to Sky Idaho team is hosting its fourth annual climate education workshop—and this year, we’re focusing fully on climate action. Based on feedback from past participants, we’ve designed a hands-on, place-based experience to help educators bring local climate solutions into their teaching.
Over three days, participants will engage in a mix of site visits, pedagogy sessions, and interactive presentations with NASA scientists, local experts, and community leaders. We’ll explore Idaho-specific climate actions grounded in the realities of energy, land use, water, and transportation—using Boise as our living classroom. While site visits will be local, the ideas and strategies are adaptable statewide. Educators from all regions of Idaho are encouraged to apply.
- This free course is hosted by Earth to Sky Idaho in collaboration with NASA, the National Park Service, and the US Fish and Wildlife Service.
- No tuition fee.
- Travel and lodging support available.
What’s Expected
- This workshop will require 4 hours of pre-work which will go toward your 2 PD credits .
- Participants will design a lesson or program that culminates in their audience creating a climate action plan. We’ll provide a flexible template and support you in adapting it to your setting.
- We ask that you join us for all three days of in-person time. The workshop is from 9:00-4:30.
What’s Included
- Funding support to offset the cost of attendance, with stipends for eligible educators. Details collected through the application.
- 2 free PD credits through NNU, BSU, or UofI.
- Food during the workshop.
Who Should Apply?
We’re looking for formal and informal educators and communicators who want to bring climate action to their audiences. Whether you work in a classroom, museum, park, nonprofit, or 4-H club, this workshop is designed to meet you where you are.
Interested in applying? Please complete the application by Wednesday, September 10th.
Download our course flyer here.
Questions? Email our program coordinators at This email address is being protected from spambots. You need JavaScript enabled to view it.
- Details

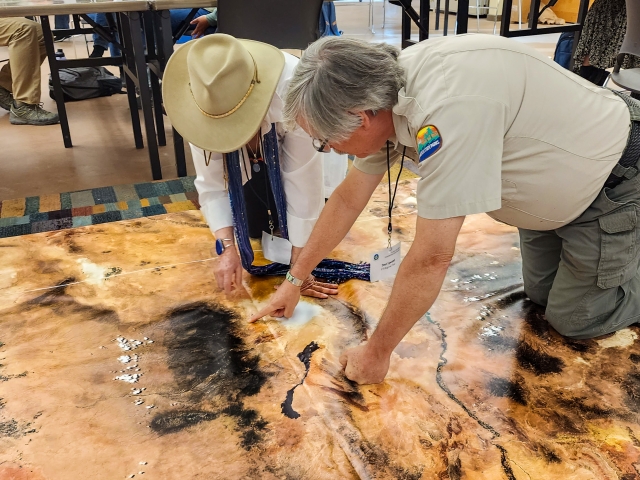 ETS New Mexico Course, 2023It’s been said that every map contains a story and every good story includes a map. Whether you use Apple Maps, Google Maps, MapQuest, or a good old-fashioned paper map, we can all agree that we’d be lost without them. But maps can do much more than just help you get from point A to point B. Maps can be powerful interpretive programming tools, and NASA makes some incredible maps!
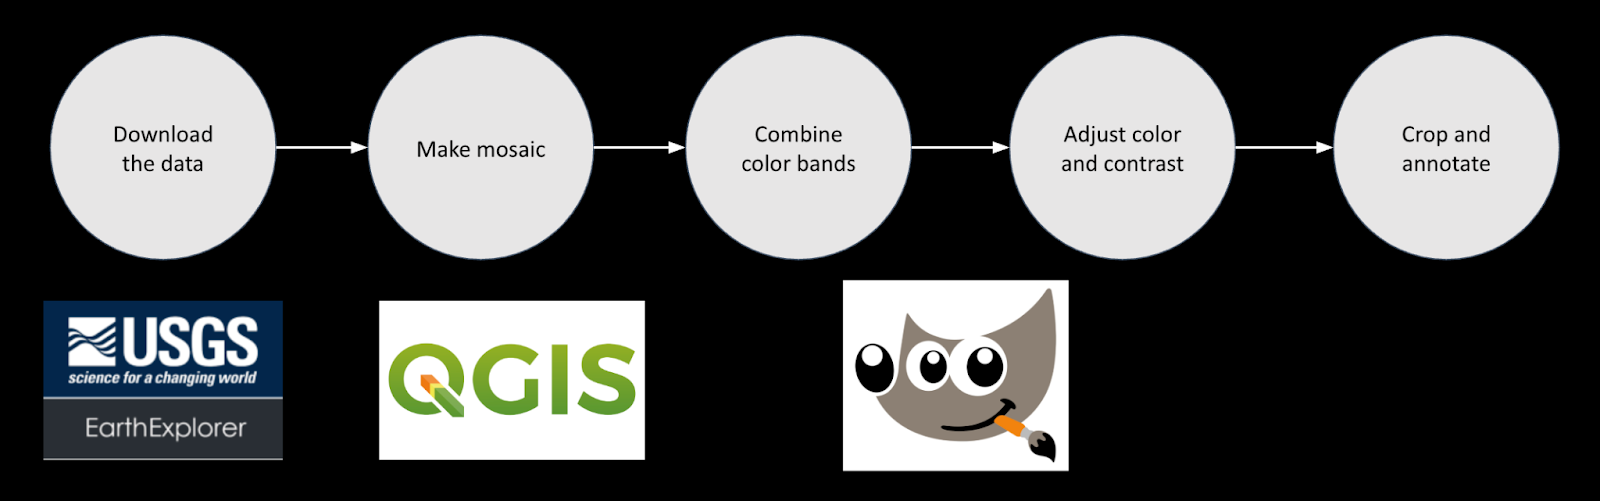
At Earth to Sky, we use maps to connect the wonder of science with the power of place. Recently, our intern Brigitte created this brand-new guide to making natural-color maps from NASA’s Landsat Mission images. Follow the steps below to create your own map or watch the tutorial from our Science in Your Pocket webinar on May 16th, 2025 “A View from Space: Making Your Own Landsat Map”!
Download existing maps on the Earth to Sky Landsat story page.
Software
For this tutorial, you will need two free open-source softwares: Quantum Geographic Information System (QGIS) and GNU Image Manipulation Program (GIMP).
If you or your organization have a license to Photoshop, you can try the Photoshop version of the tutorial.
Workflow
Follow the 5 steps below to create a map of your own. This process will take around 2 hours the first time.
Step 1: Downloading the Data
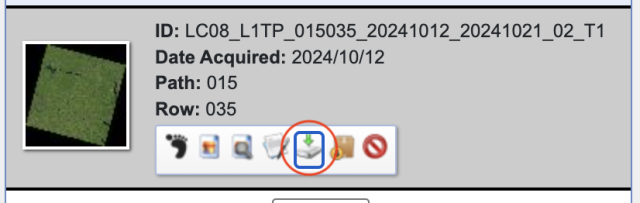
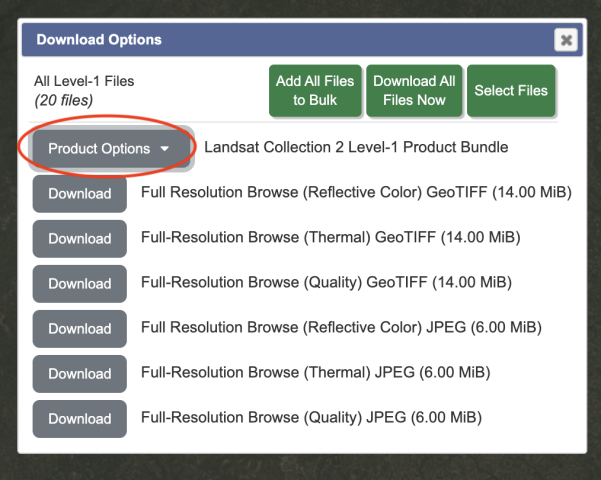
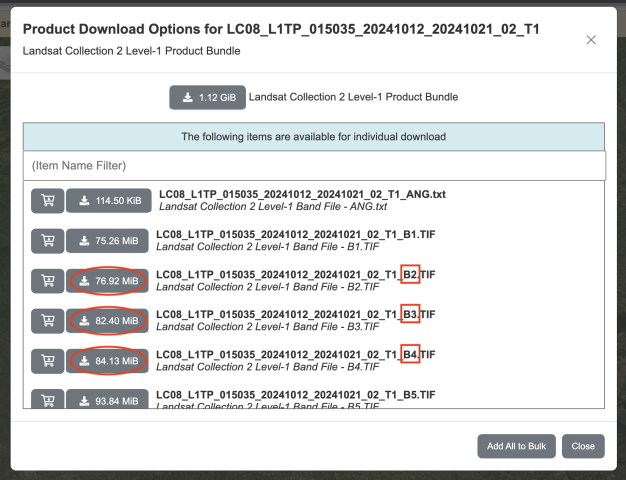
This tutorial will retrieve Landsat data from USGS Earth Explorer. First, you will need to make a free profile and set up your account. After making sure you are logged in, follow “Part 1: Downloading the Data” from NASA Landsat’s Creating a Landsat Image tutorial. In Step 7, after clicking “Product Options,” you can select which individual files rather than the entire package. For natural-color, we want bandcombo B2 (blue) B3, (green), and B4 (red). The files are all GeoTiffs (Tagged Image File Format), which means they include georeferencing data.
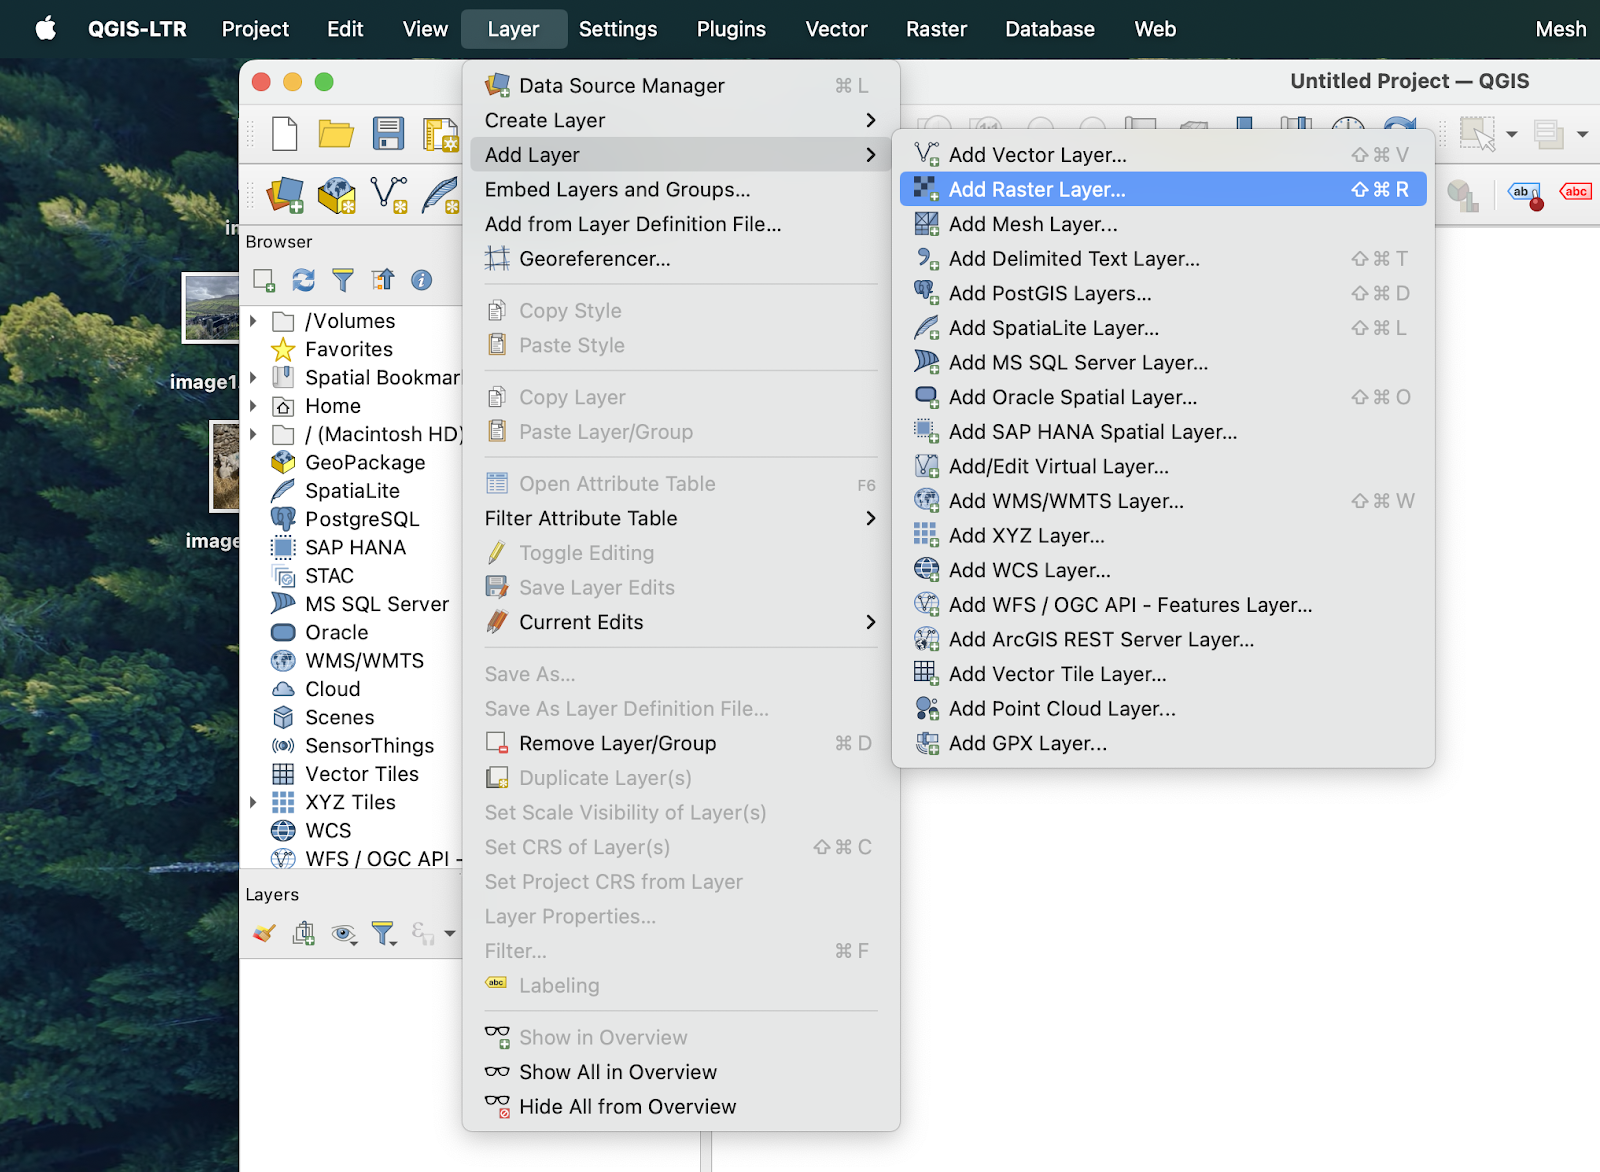
Step 2: Mosaicking – QGIS
- Open QGIS
- “New Project” (icon at upper left)
- The goal of this step is to make three mosaics, one for each color. You will do the following steps three times (once for B2, once for B3, once for B4).
-
- “Layer” → “Add Layer” → “Add Raster Layer…” → Next to “Raster dataset(s)”, click the “Browser” icon. → select all images (of one bandcombo, i.e. select all B2 tiff) → Click “Add” then once they pop up in the background you may click “Close”
-
- You can reorder the layers front to back by dragging them up or down in the lower left “Layer” panel. If one image has clouds or the seam is very visible, etc. you may be able to cover it up with another image
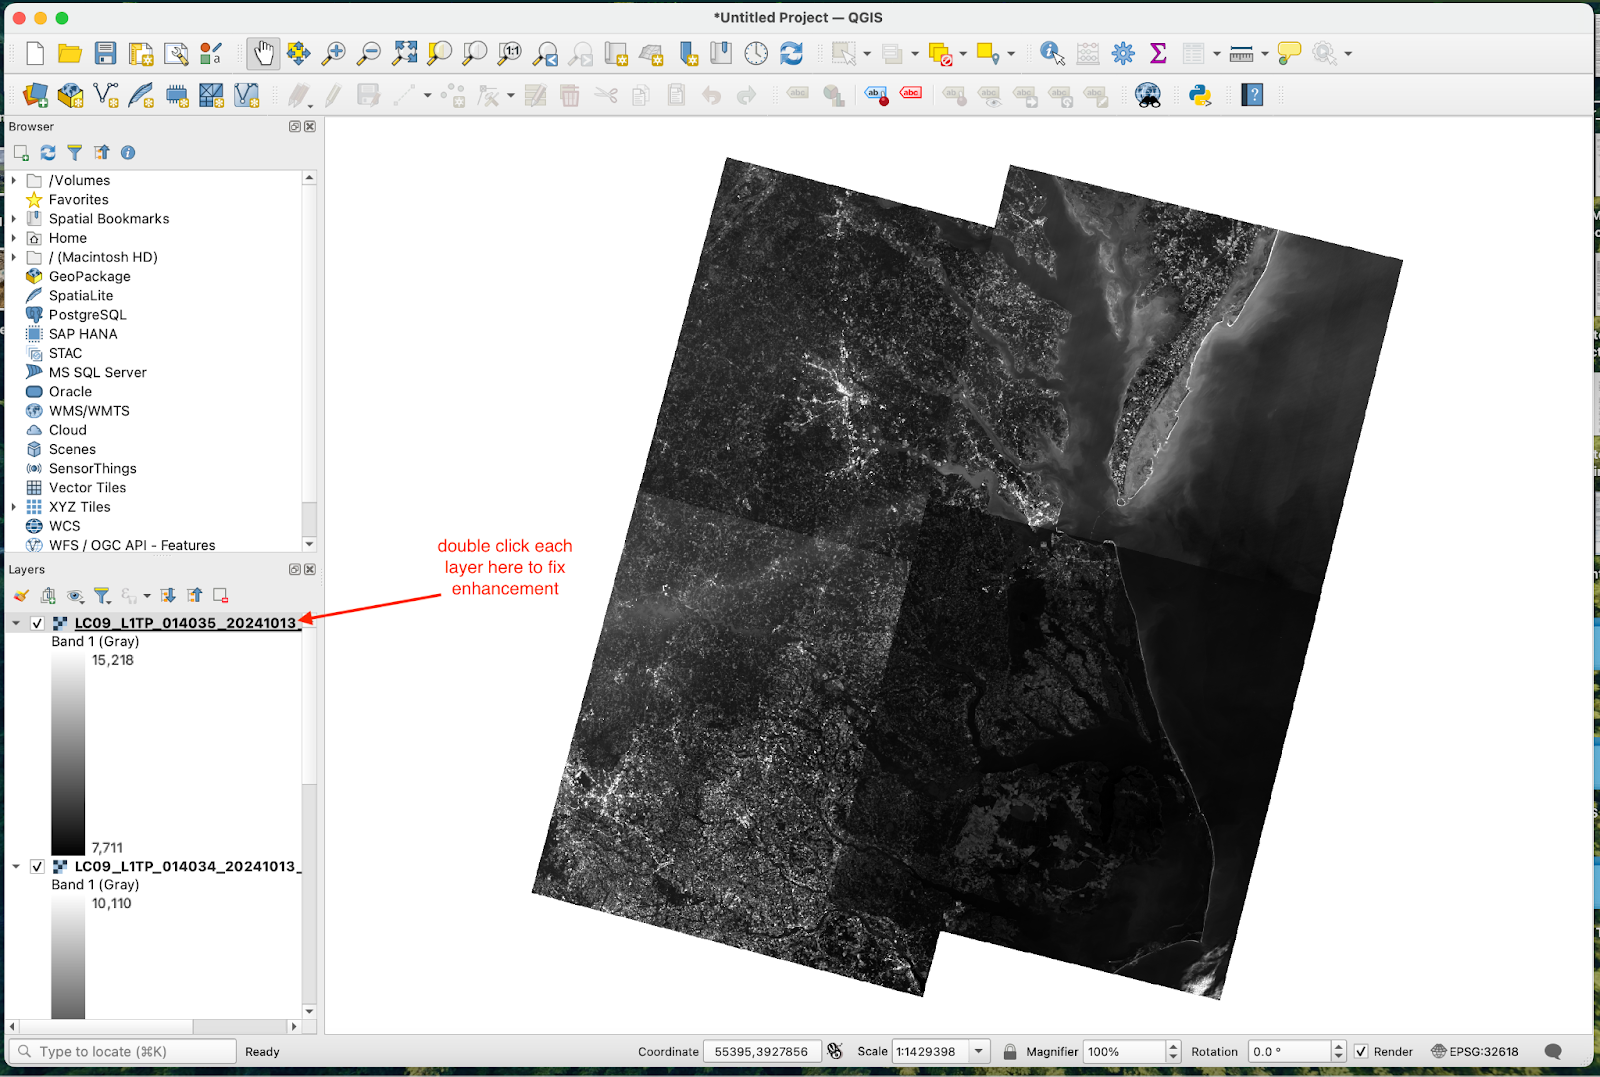
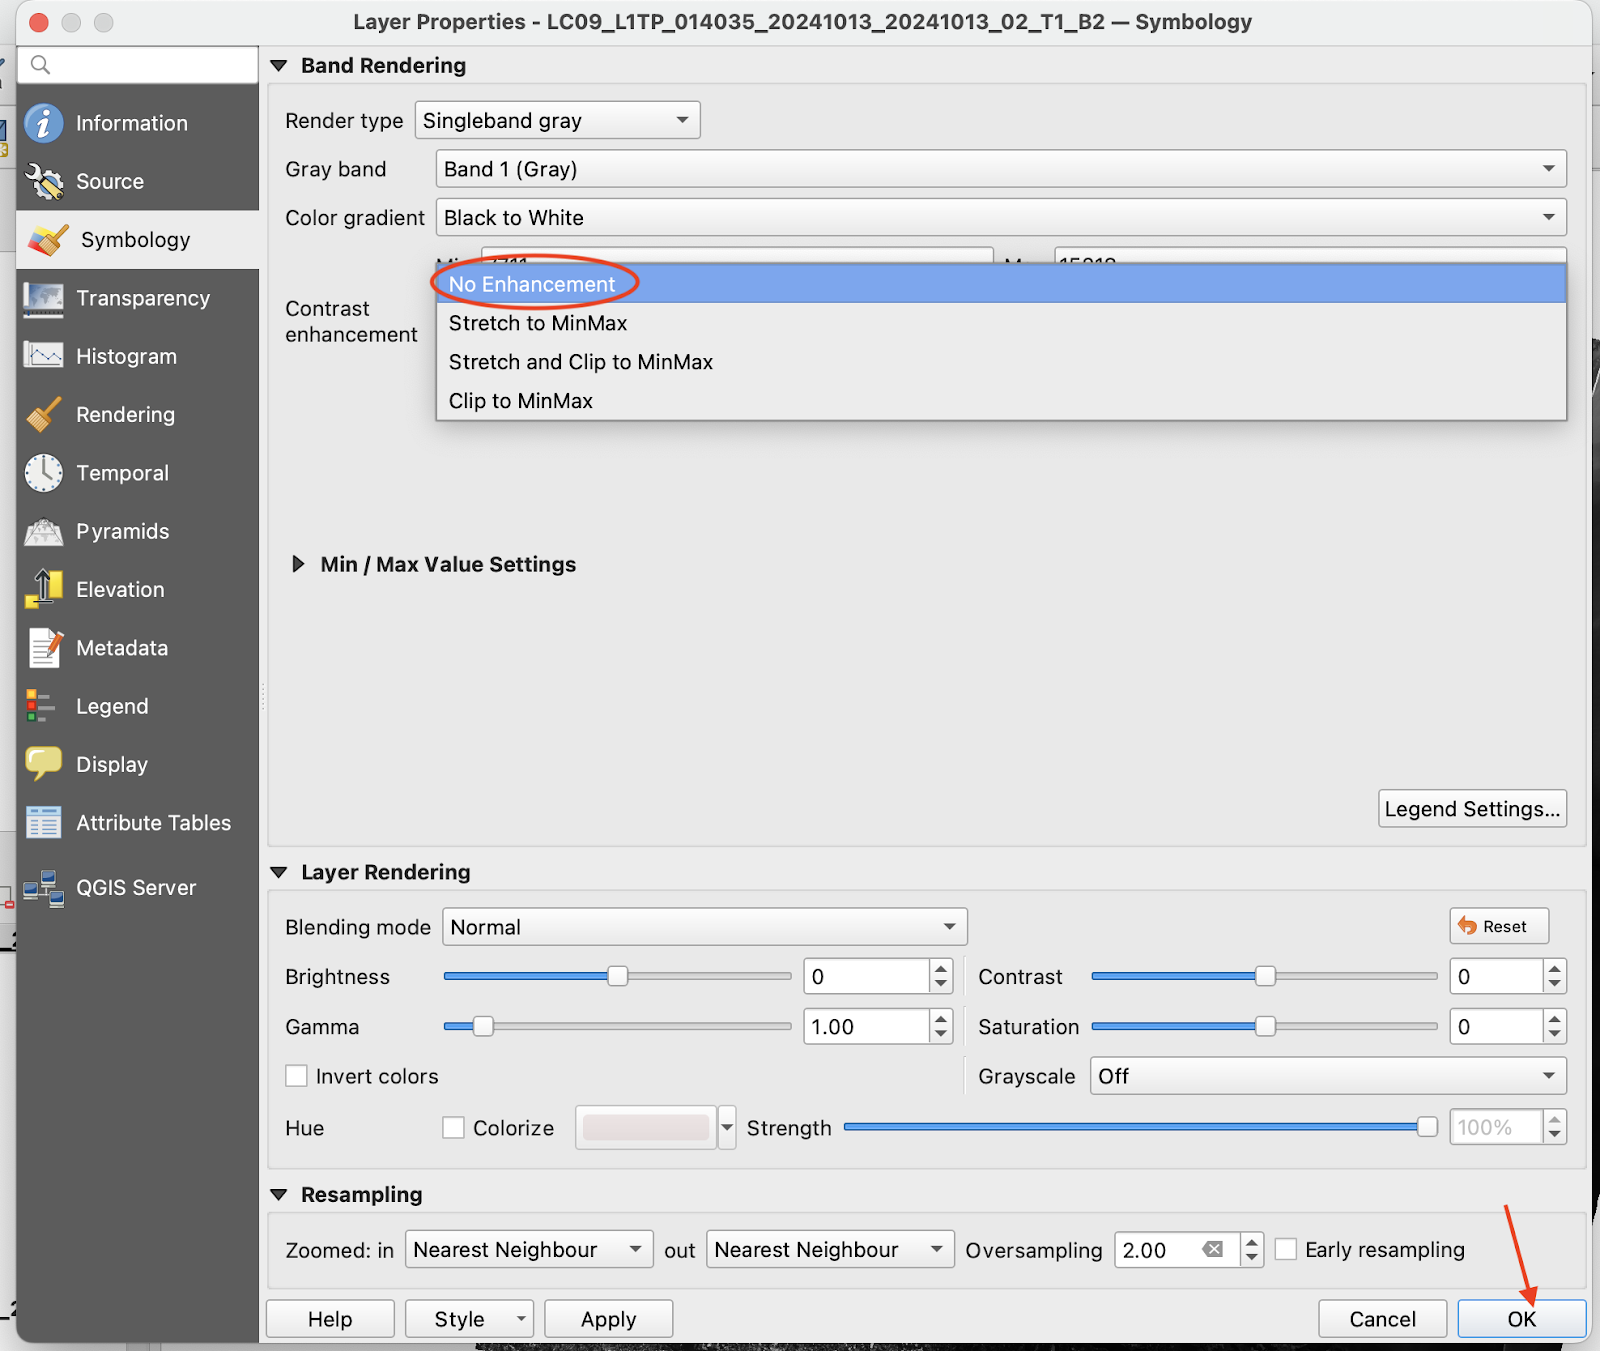
- Double click each file name (in the lower left “Layer” panel) and set “Contrast Enhancement” to “No Enhancement” then click “OK.”
-
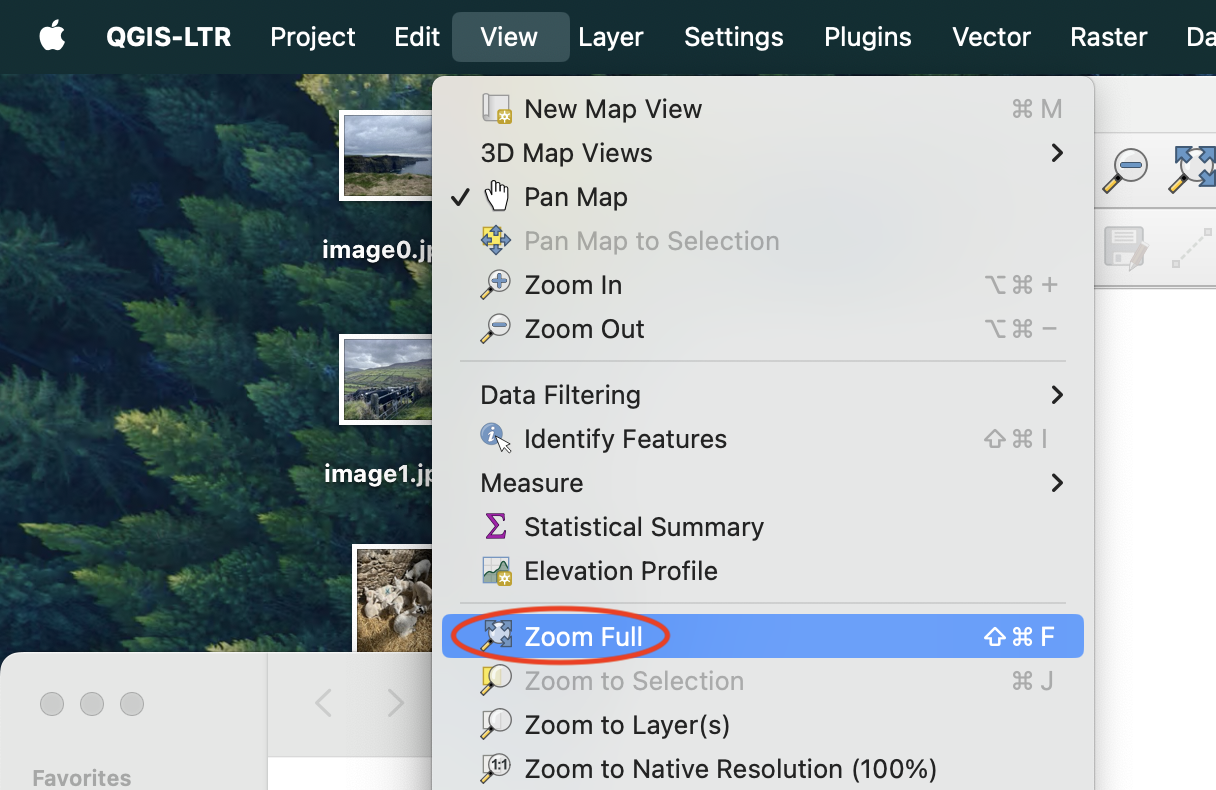
- To get the entire image centered, click “View” → “Zoom Full”. This will ensure all the images are aligned when we open them later on.
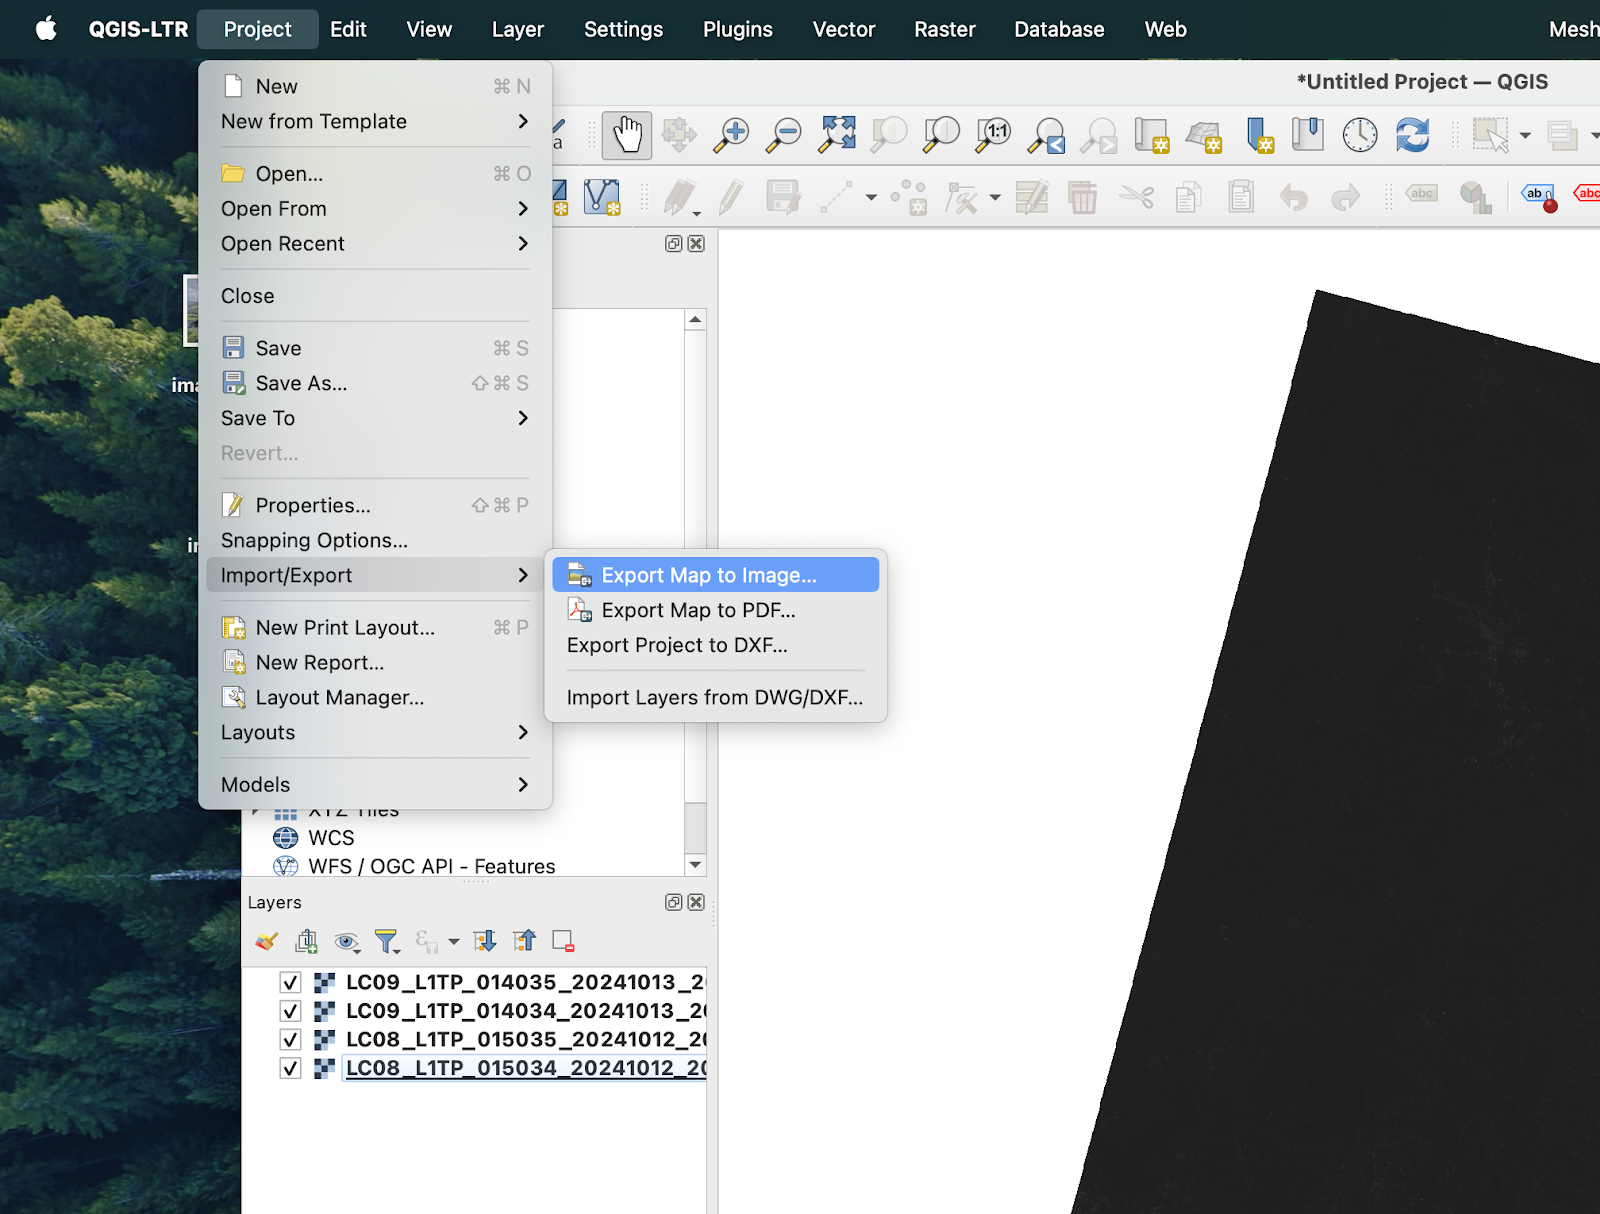
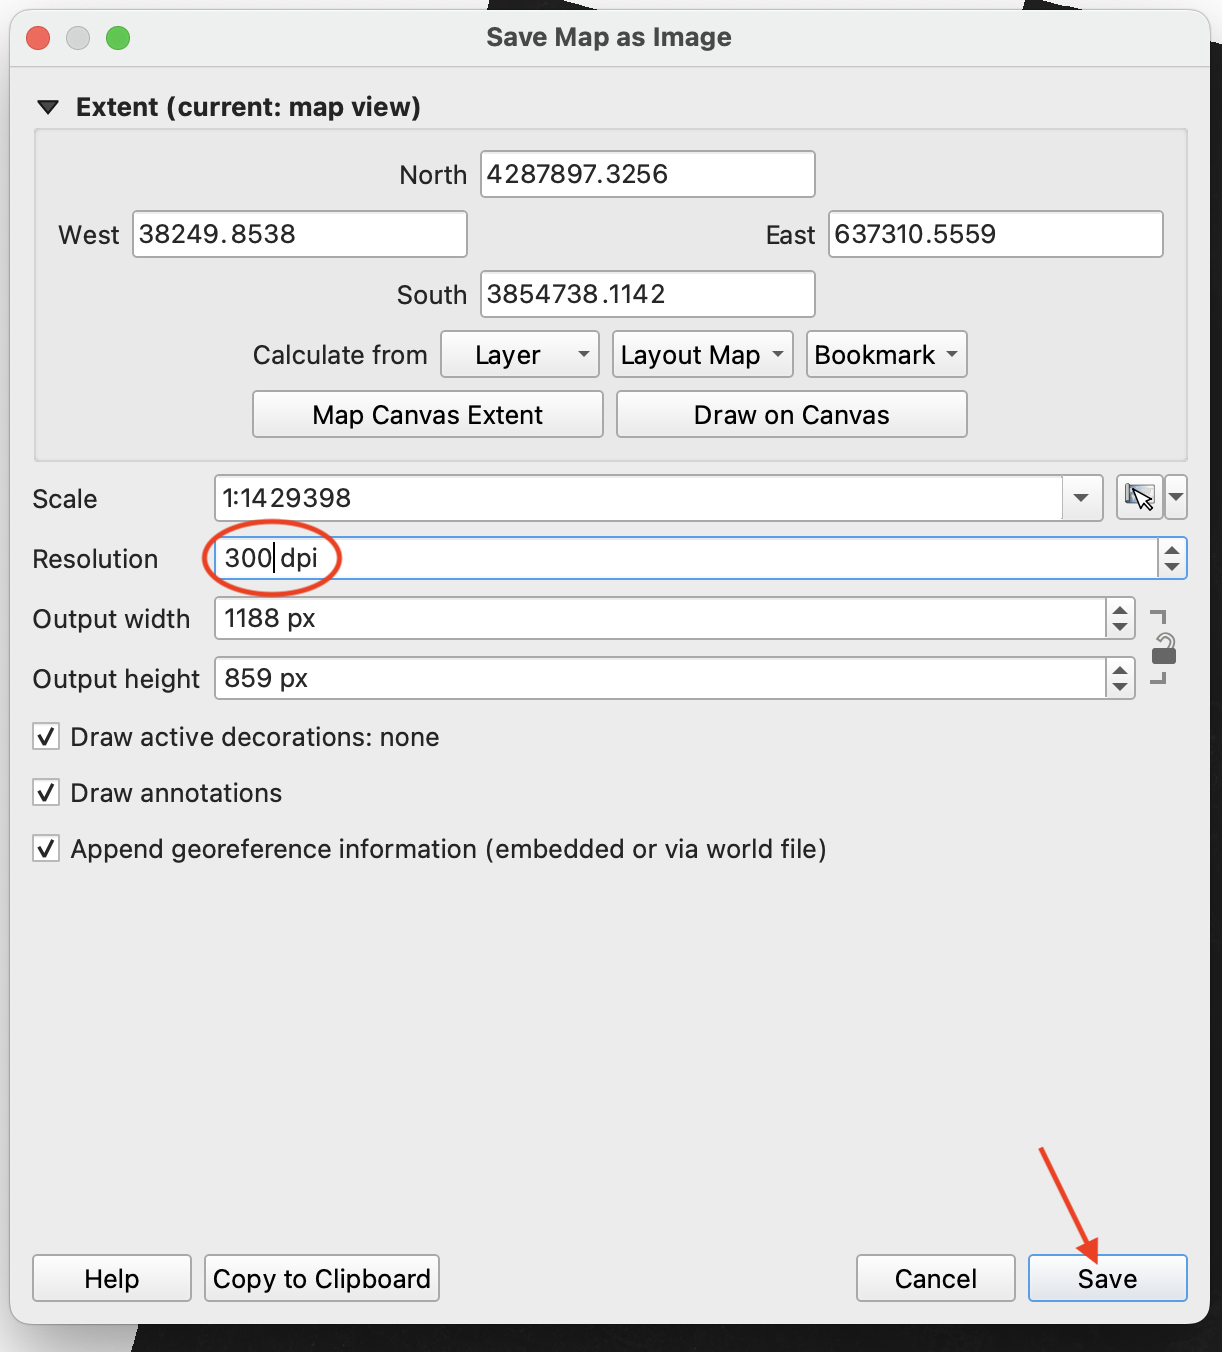
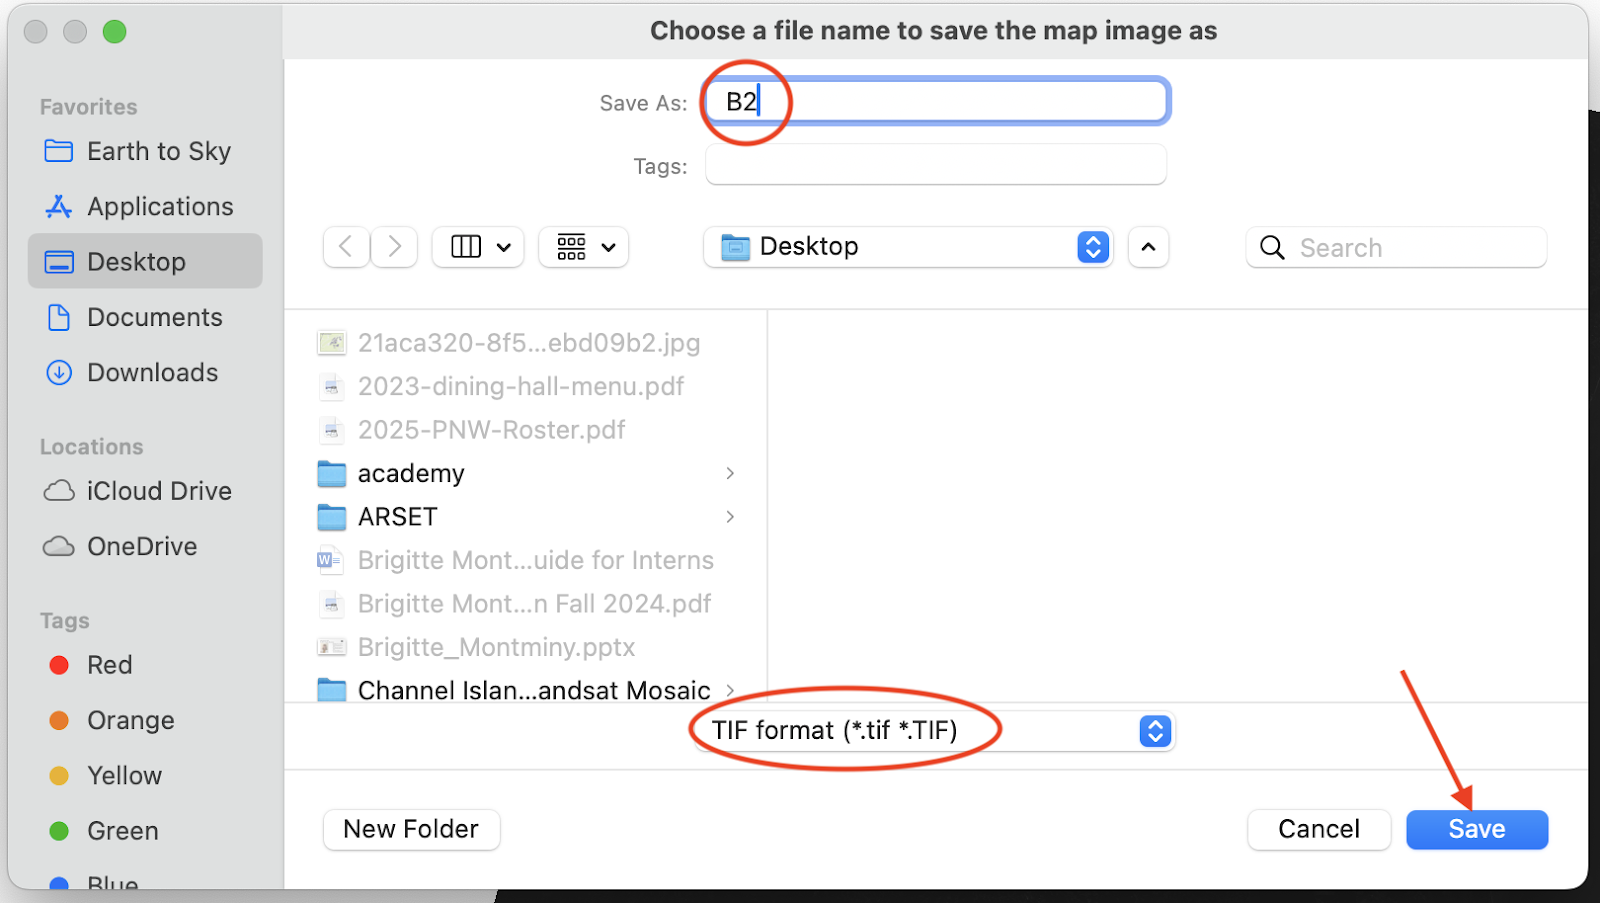
- “Project” → “Import/Export” → “Export Map to Image” → set “Resolution” to 500 dpi → “Save” → name the file (ex. B2), select the location, and select .tif
- The resolution depends on your map area, computer storage capacity, and desired outcome. Feel free to mess around with the resolution a bit.
Now, you should have three mosaics saved as .tif files, one for each bandcombo (B4, B3, B2).
NOTE: QGIS may save xml files into your folder for each individual file. You can ignore these.
Step 3: Merging Channels – GIMP
The goal of this step is to combine the three mosaics you just made into one mosaic that is RGB.
- Open GIMP
- “File” → “Open” → select your B2, B3, and B4 mosaics → “Open” → wait for all three images to load, this may take a moment and there may be other windows to pop up, but they should automatically close)
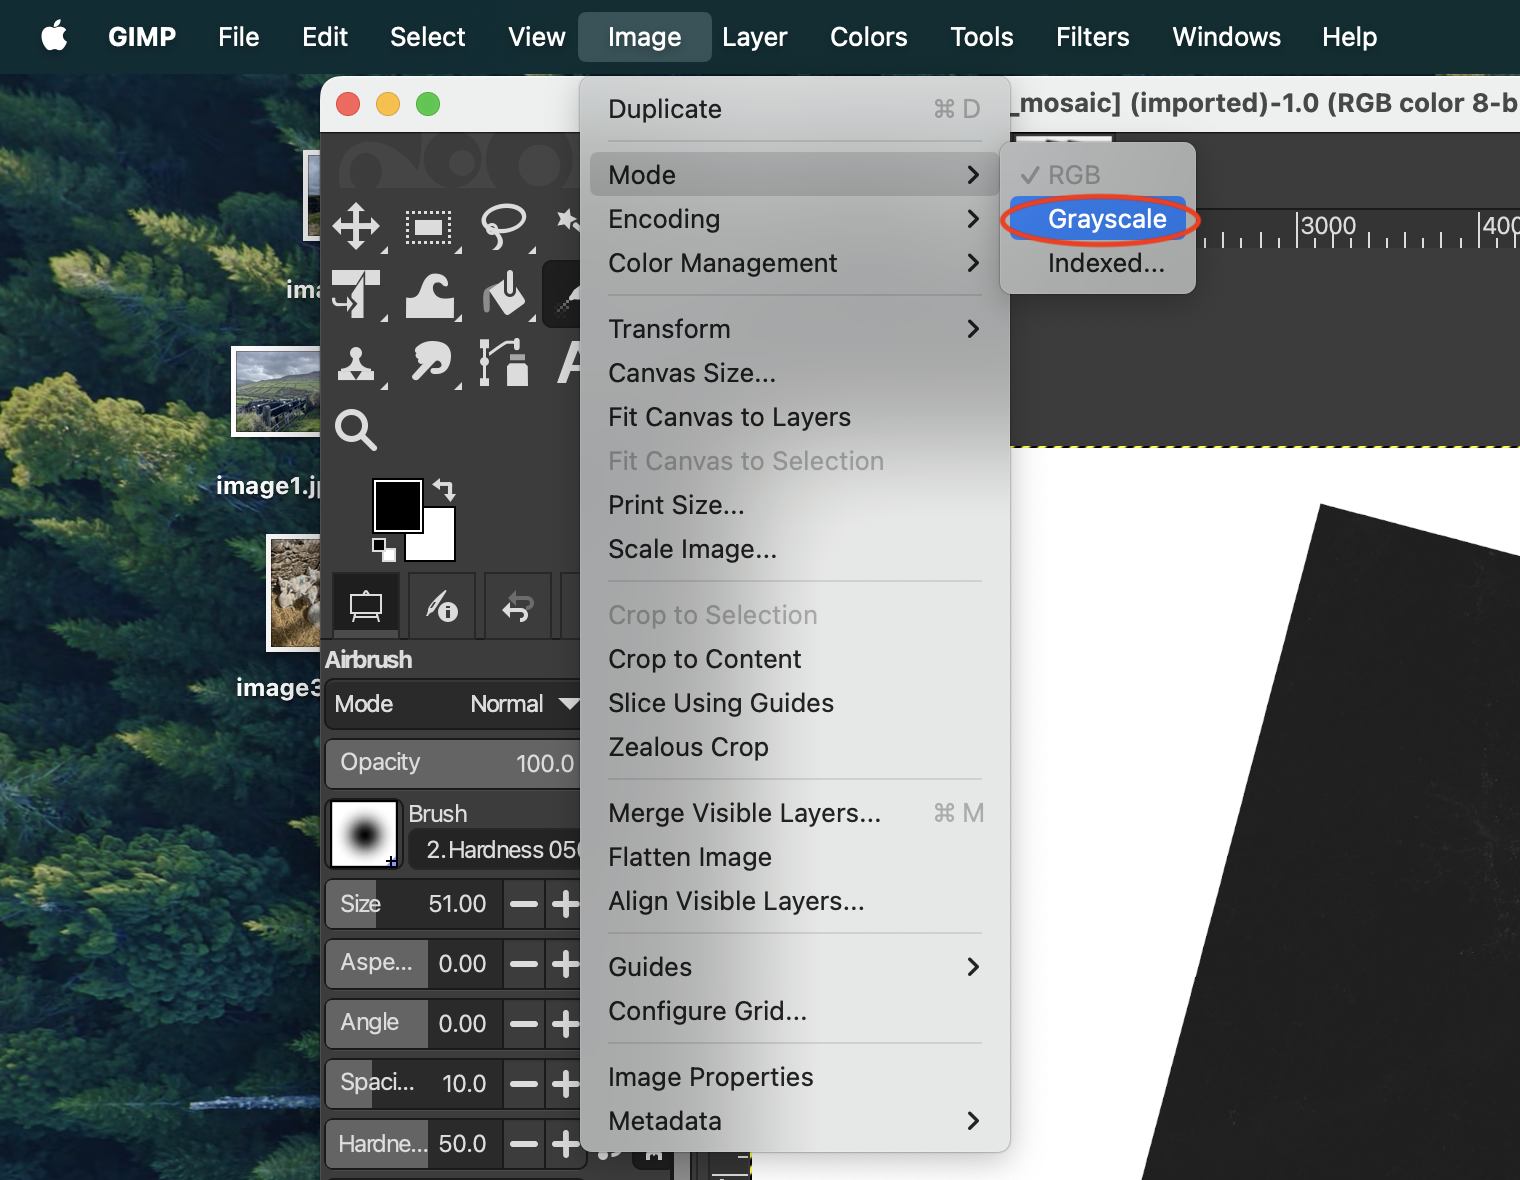
- At the top area, you should see three tabs (one for each of your mosaics). One by one, go to each image (by clicking on it in the tabs) and click “Image” → “Mode” → “Grayscale”. Make sure you do this for all three.
- Now combine the three mosaics into one full-color mosaic.“Colors” → “Components” → “Compose” and wait for a smaller window to pop up.
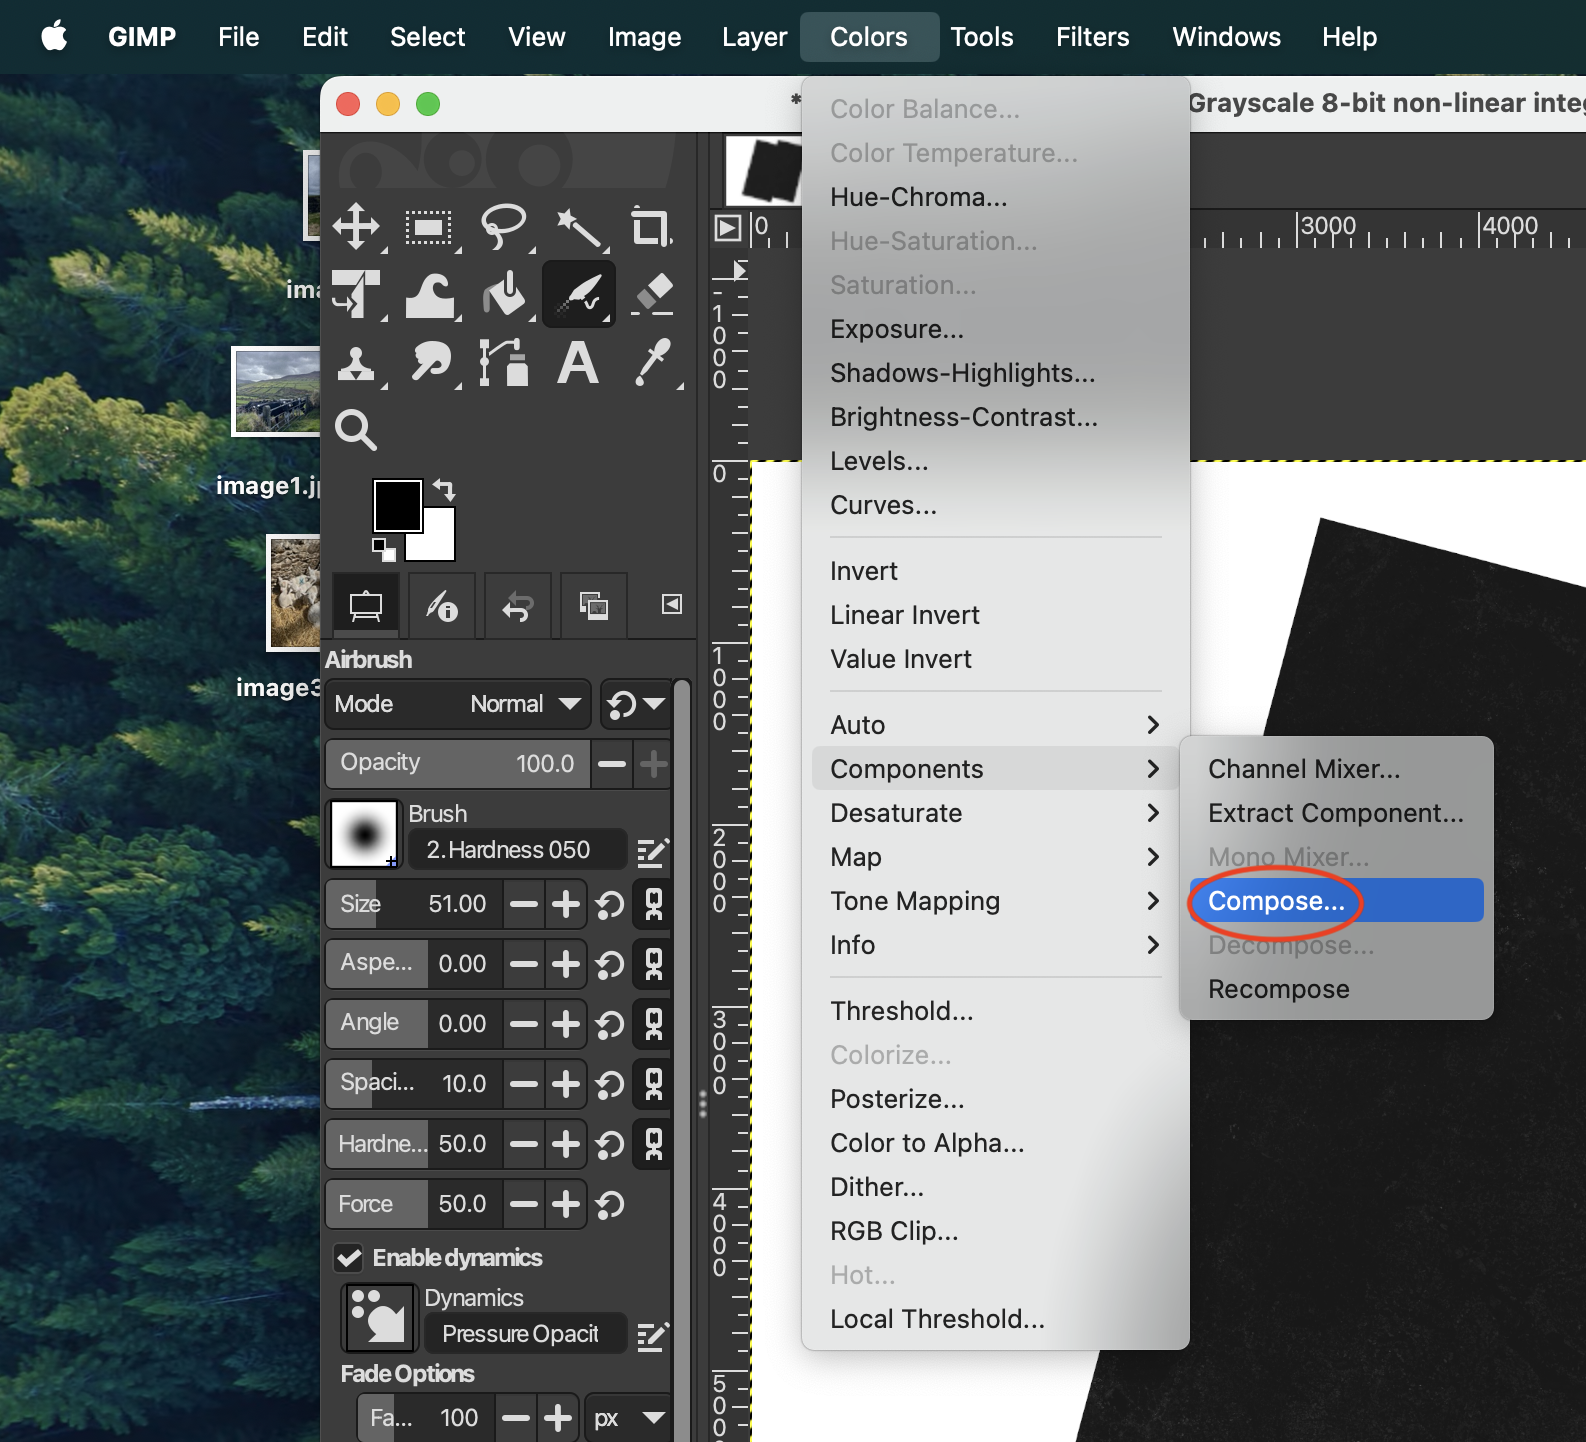
- Assign each bandcombo mosaic to the color using the dropdown buttons (red is B4, green is B3, blue is B2) → “OK”
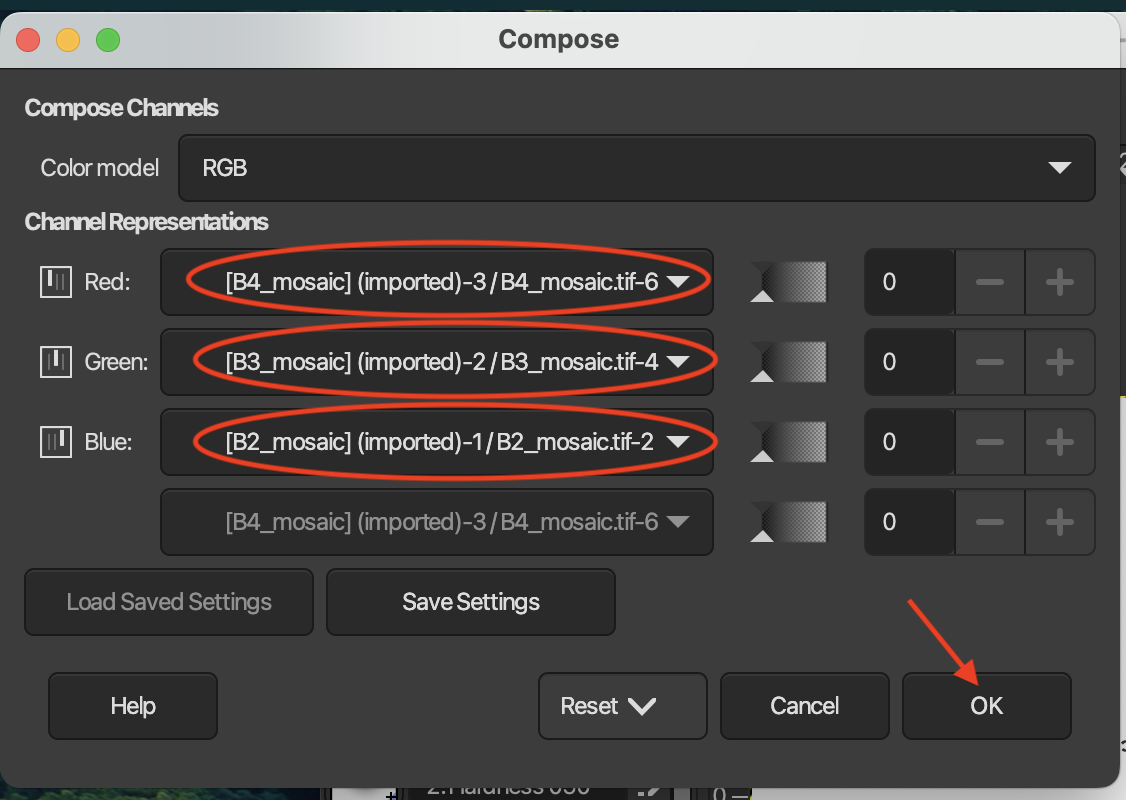
Wait for a new file to open (it will still look all black, should not be bright colors yet)
Step 4: Adjusting Color – GIMP
The goal of this step is to adjust the contrast and colors to create our full natural-color map.
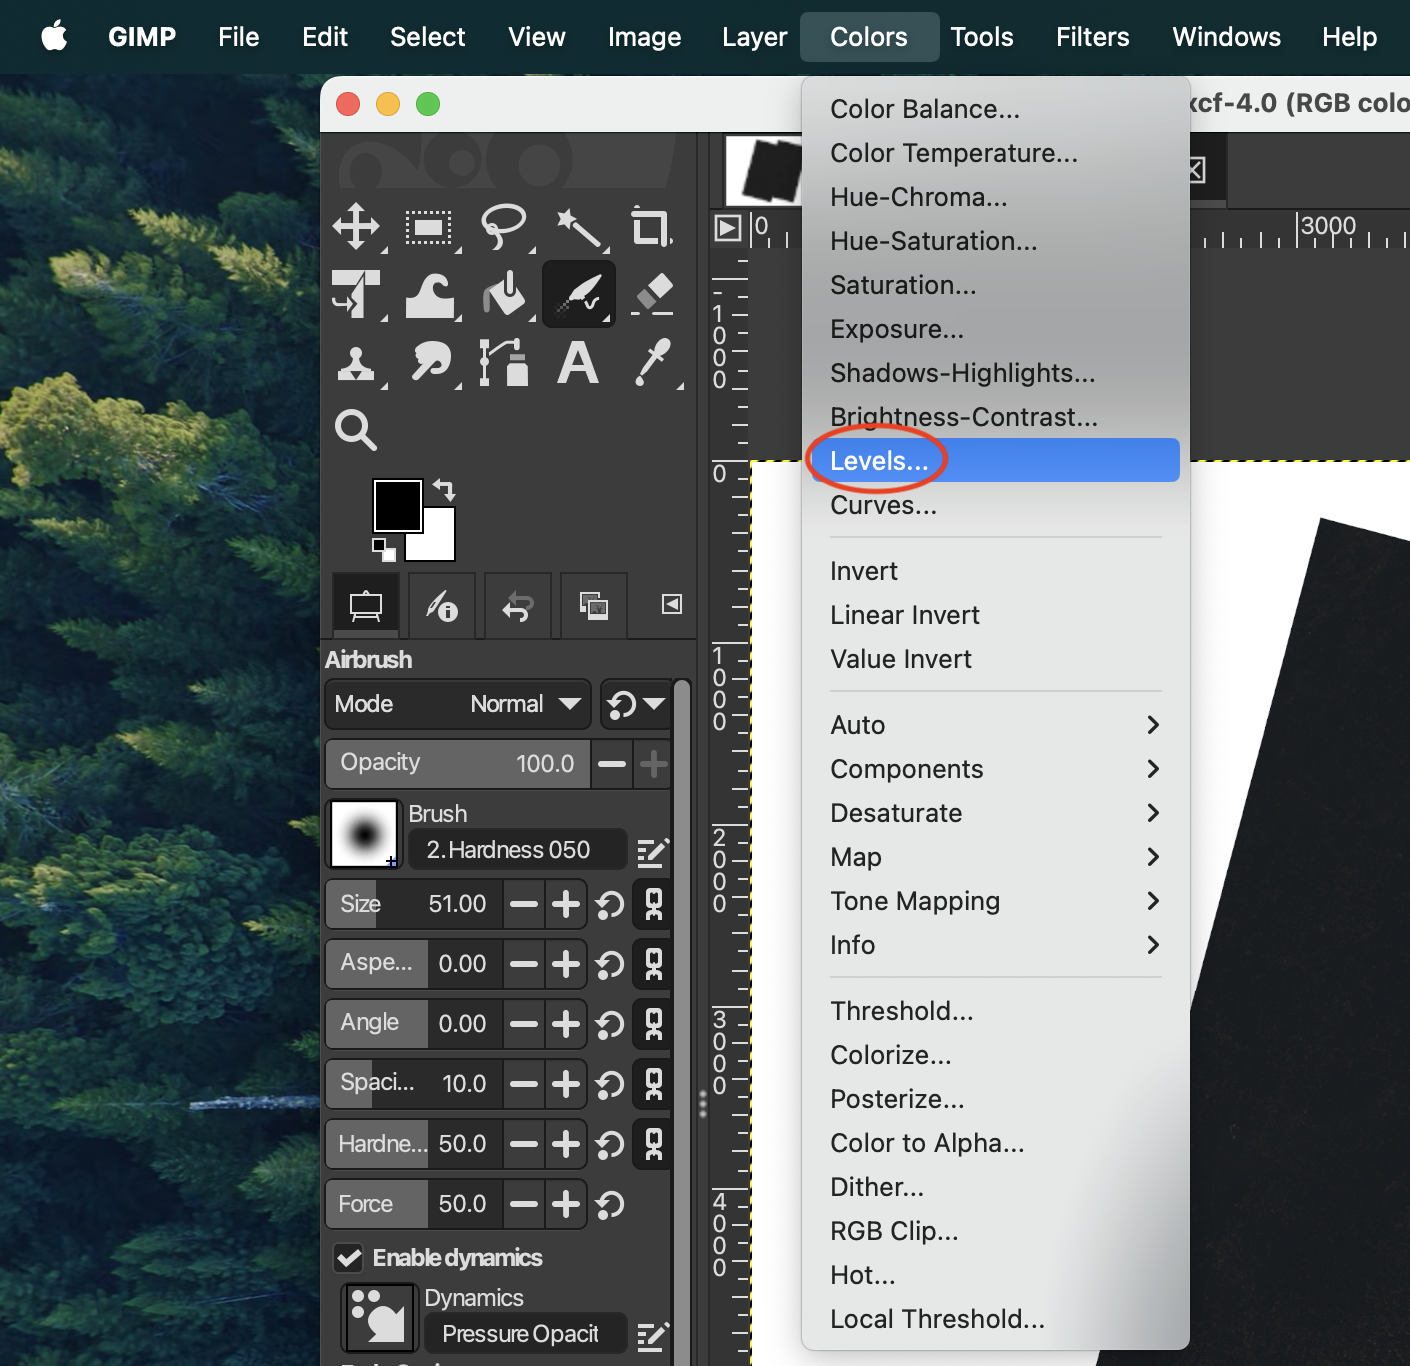
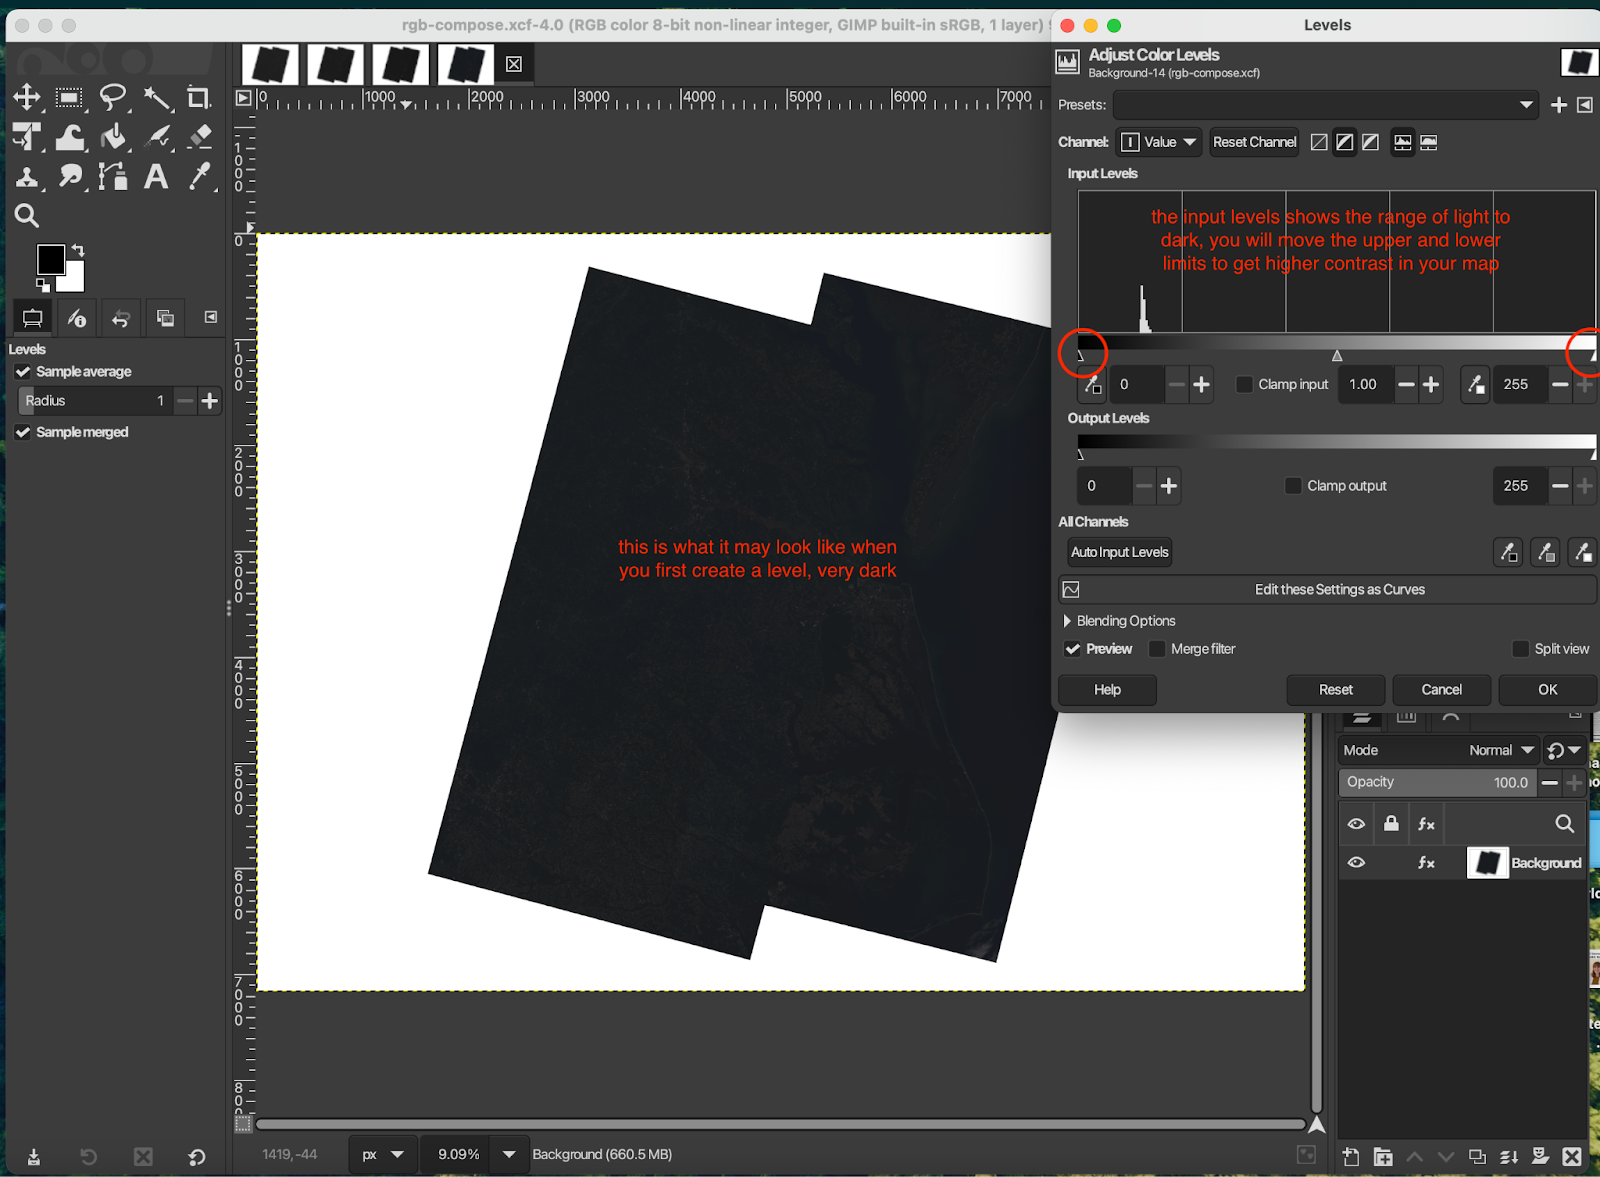
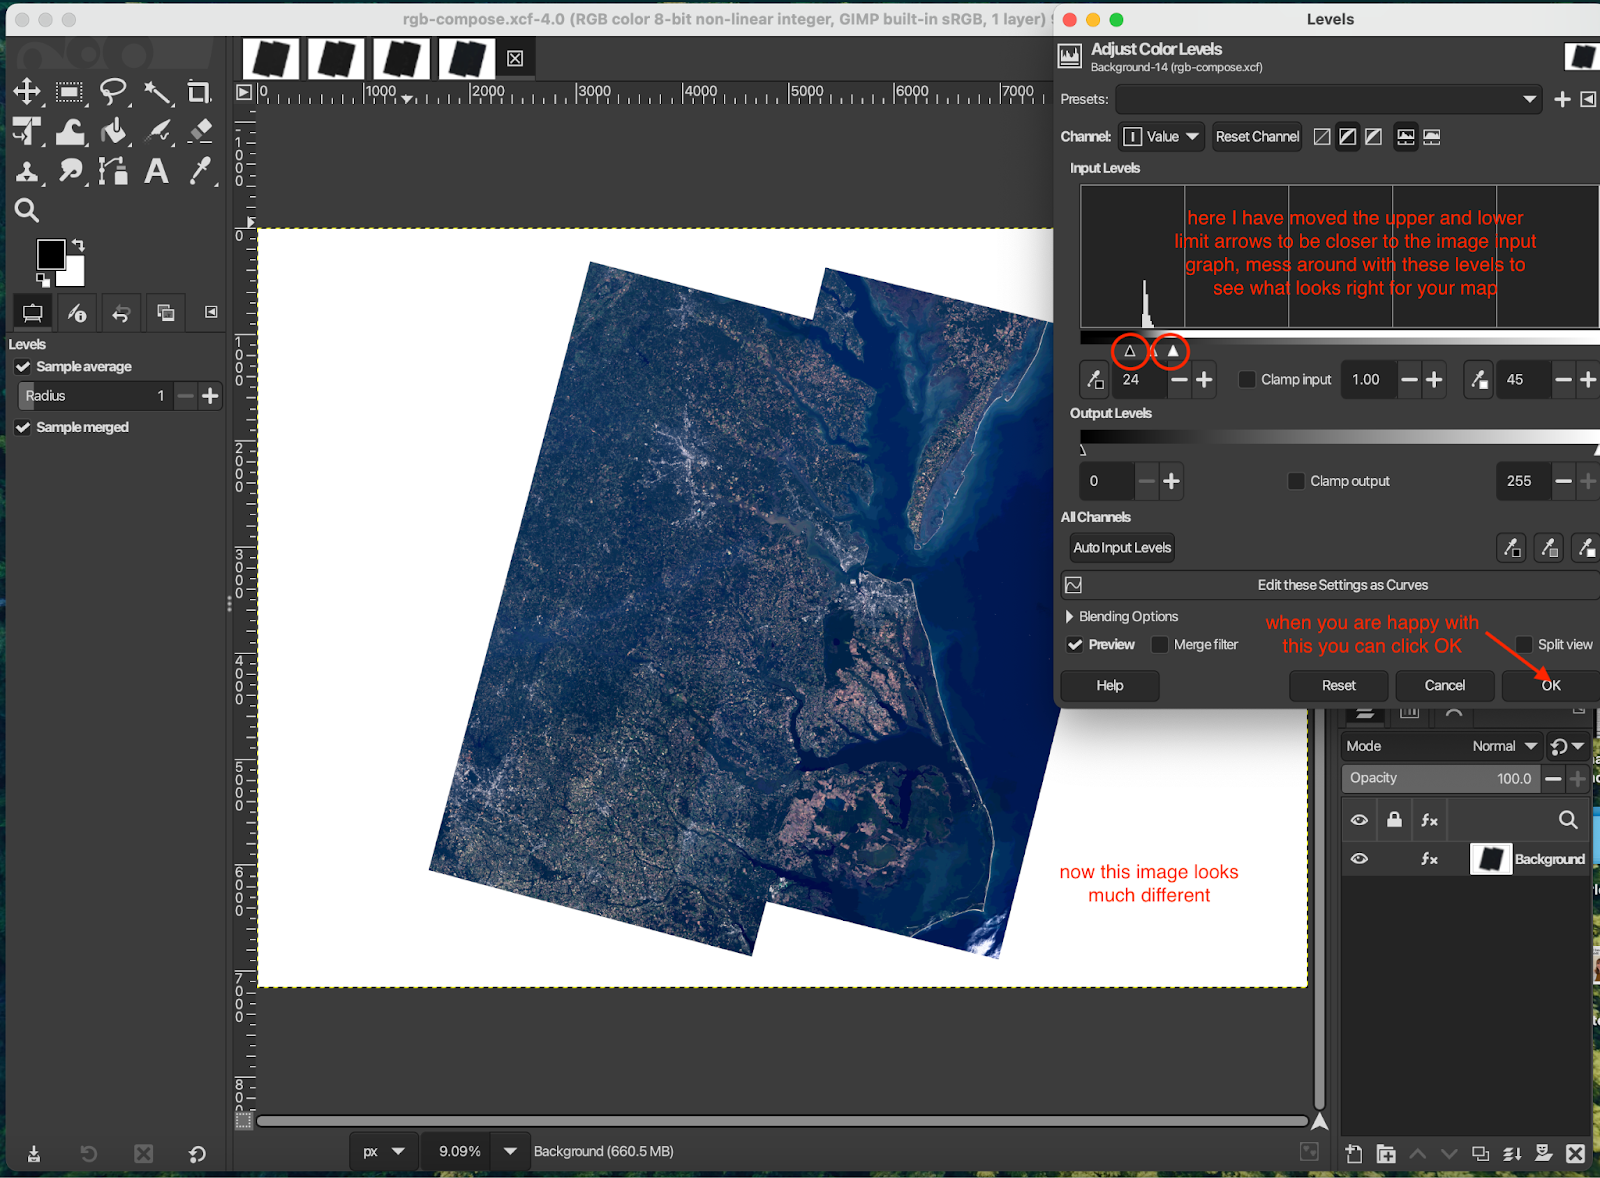
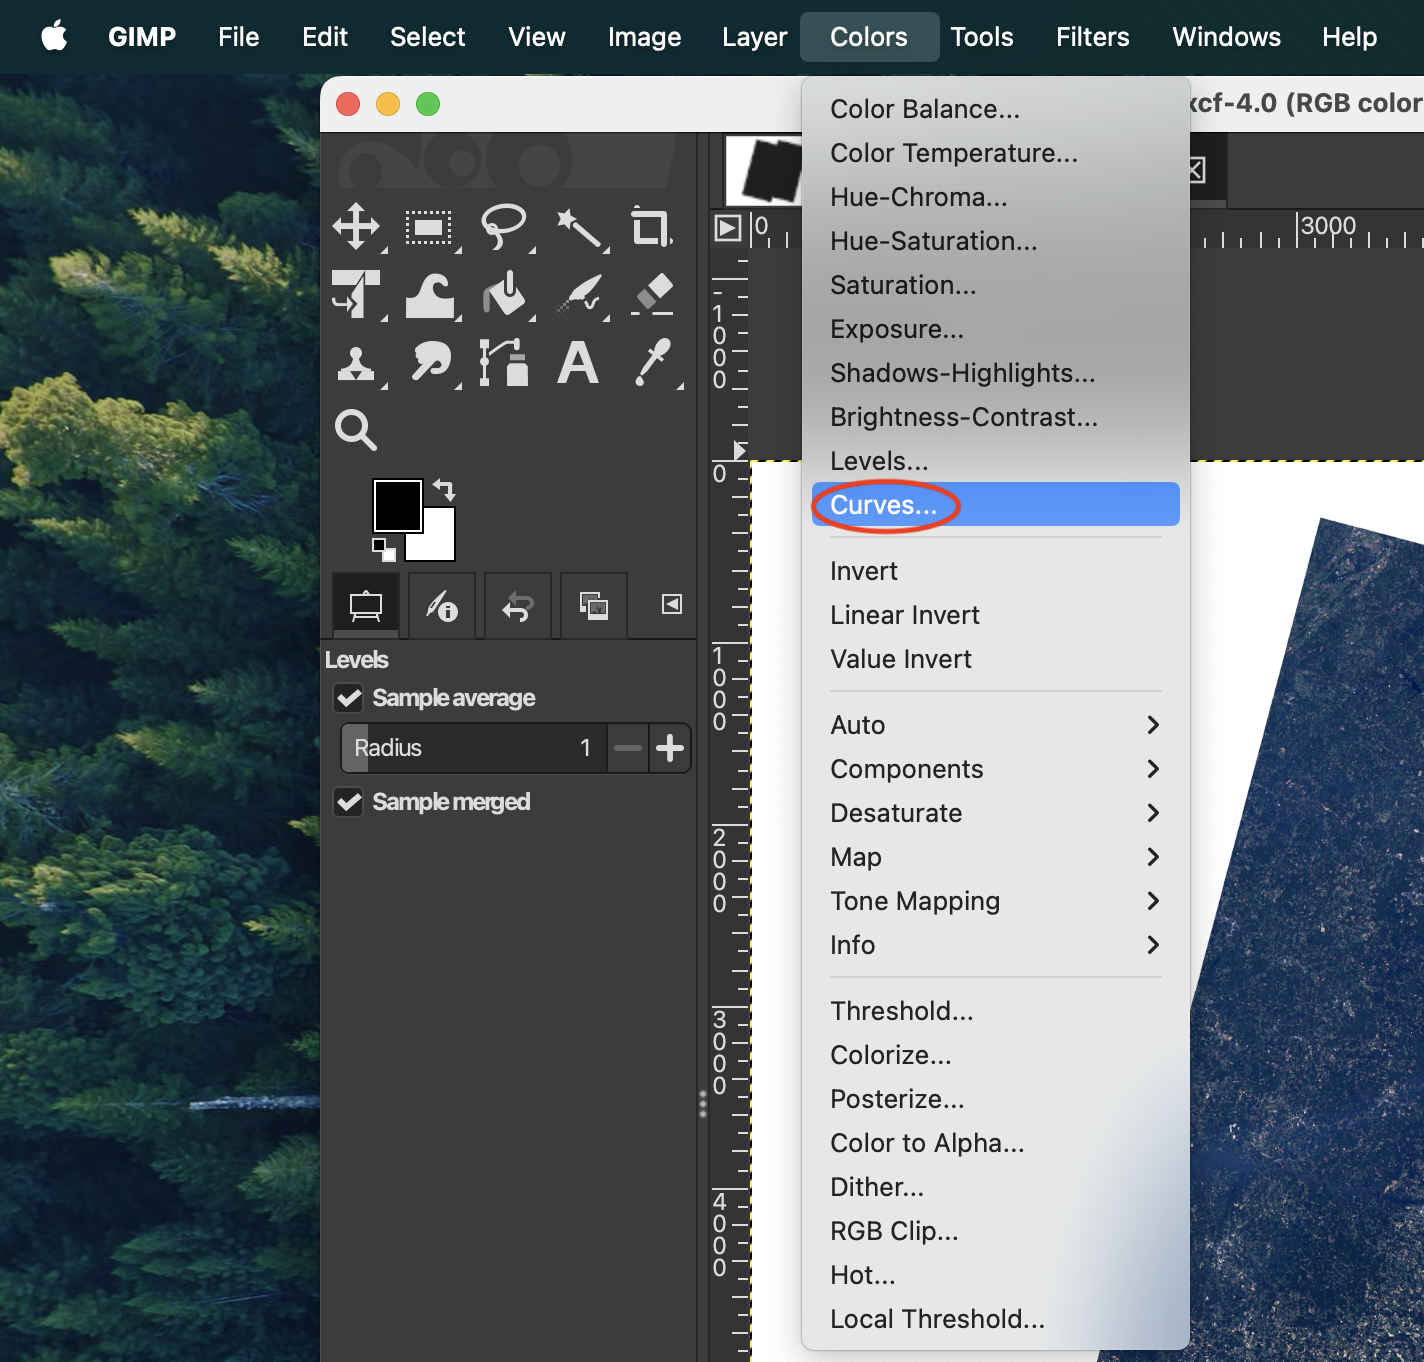
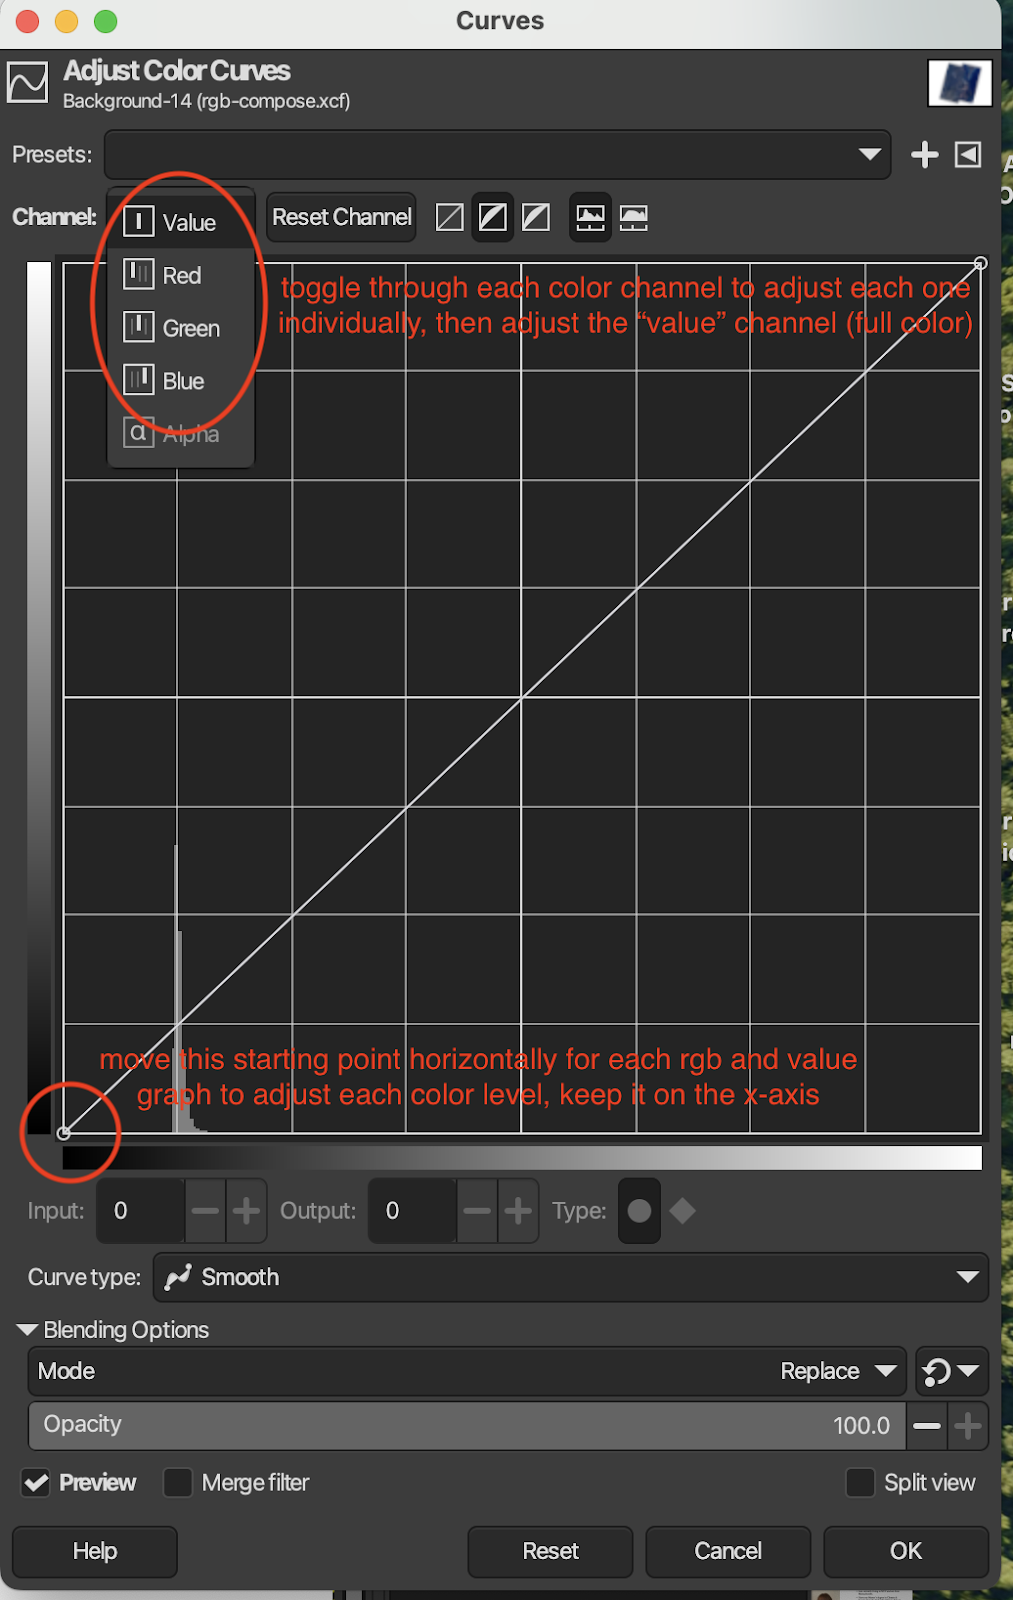
- “Colors” → “Levels…” → The window that pops up will have a graph for the input levels, we want to manually adjust the input level high and lows (light and dark) by moving the arrows right below the “Input Levels” graph (see images below). The goal is to lie on either end of the spikes on the histogram. Mess around with these levels until the contrast on your map allows you to see more details → “OK”
- “Colors” → “Curves…” → A small window will pop up that will allow you to manually adjust rgb curves and the total curve. Adjust the first point of each curve to sit between the start of the graph and the first major histogram spike. You can toggle between each color (red, green, blue, total) with the dropdown menu next to “Channel”. On the “Value” channel, add a point to the histogram to smoothen out the colors by clicking on the histogram. You can move this point up and down to adjust the brightness. Again, mess around with these graphs until you are happy with how your map looks.
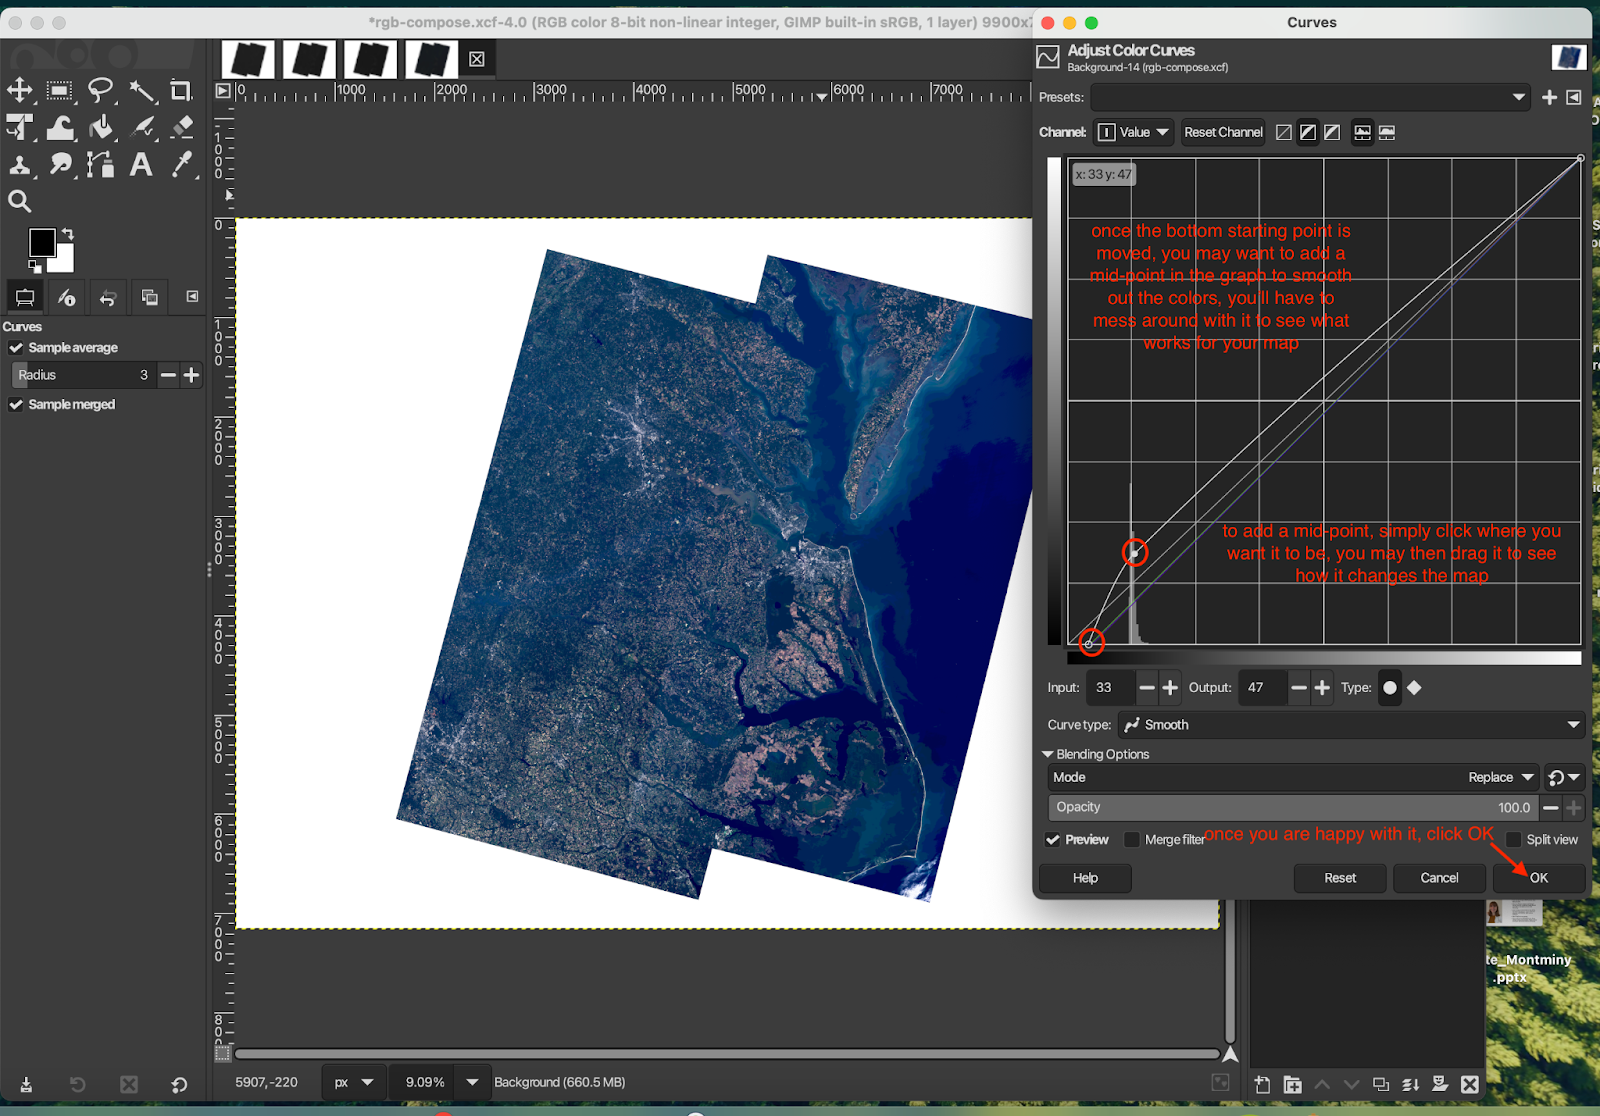
- File → Save → this will save your work as a xcf file format
- File → Export → you may choose to save it as a png, jpg, etc.
Step 5: Crop & Add Annotations
Time to finalize your map!
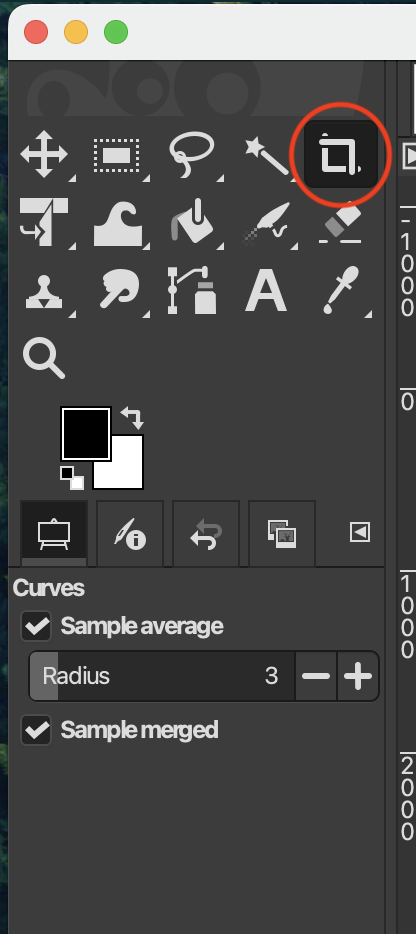
Cropping: select the crop icon in the upper left hand toolkit, then click and drag on your map where you want to crop
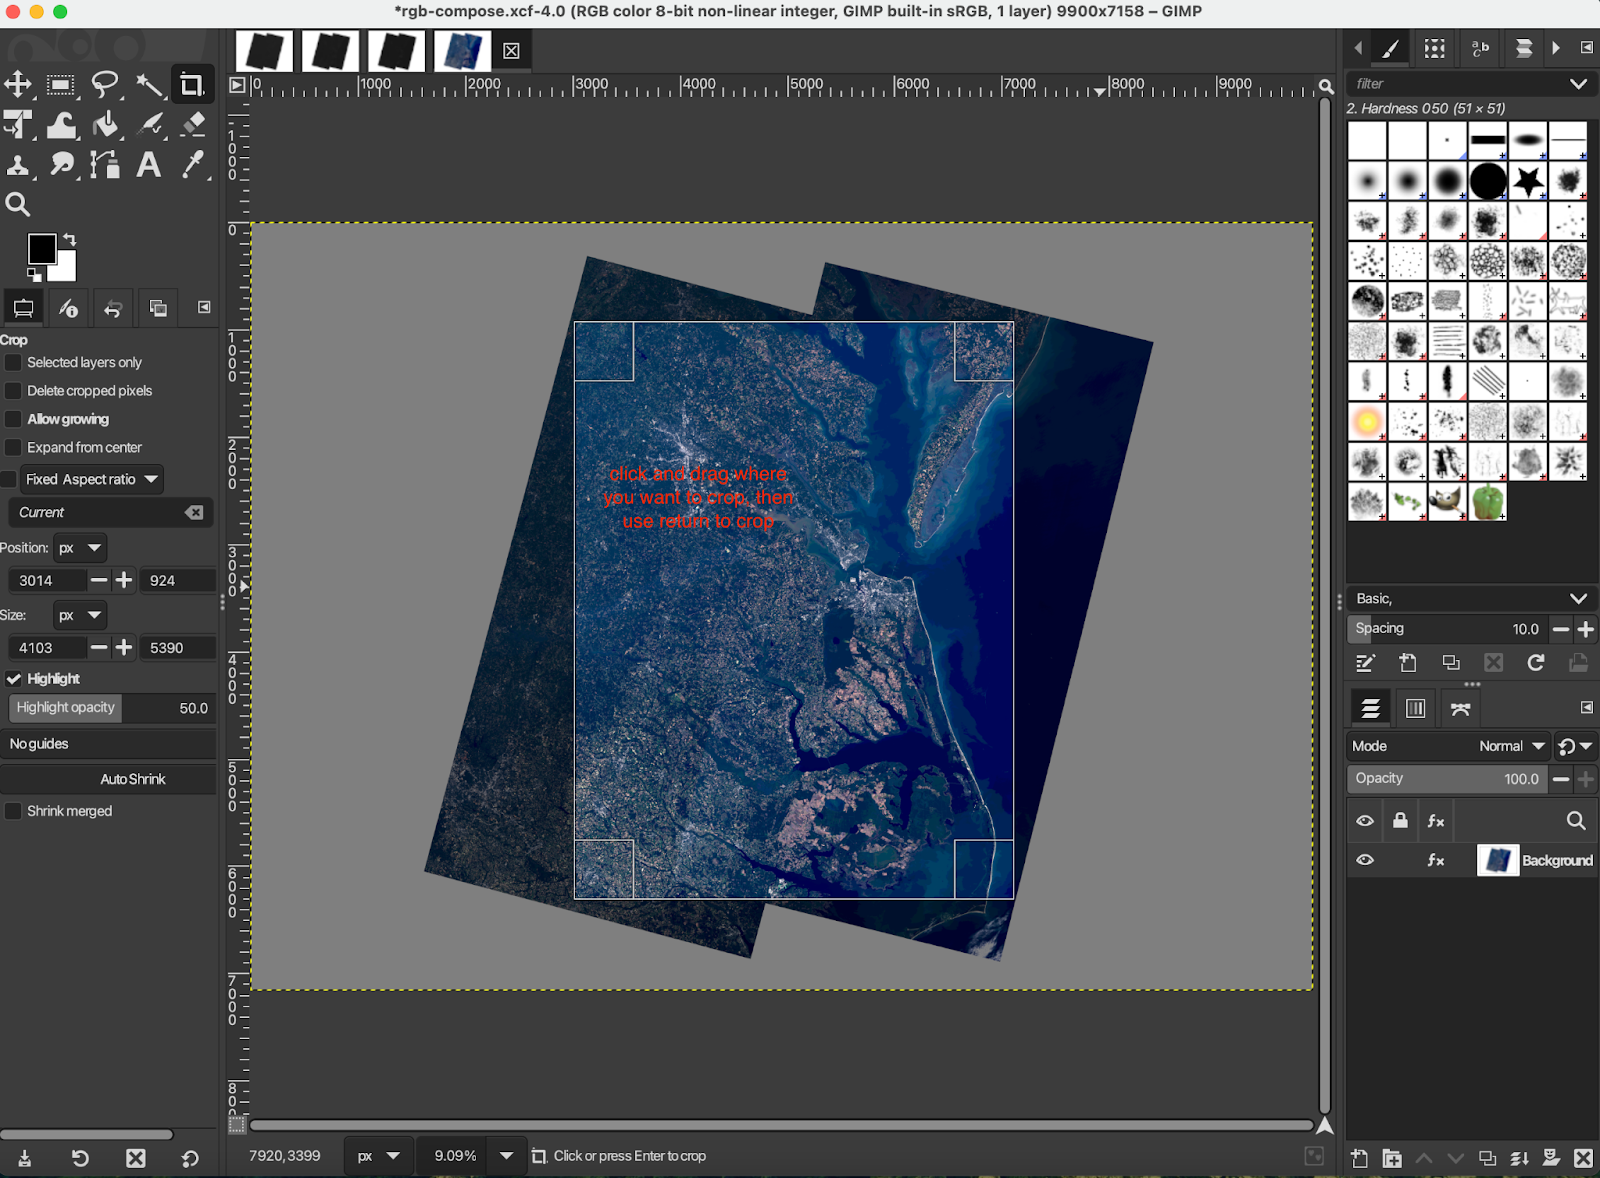
Annotations you may want to include:
- Name of your region
- Observing satellite (Landsat 8/9)
- Data acquisition date
- North arrow
- Scale bar
Here's an example!
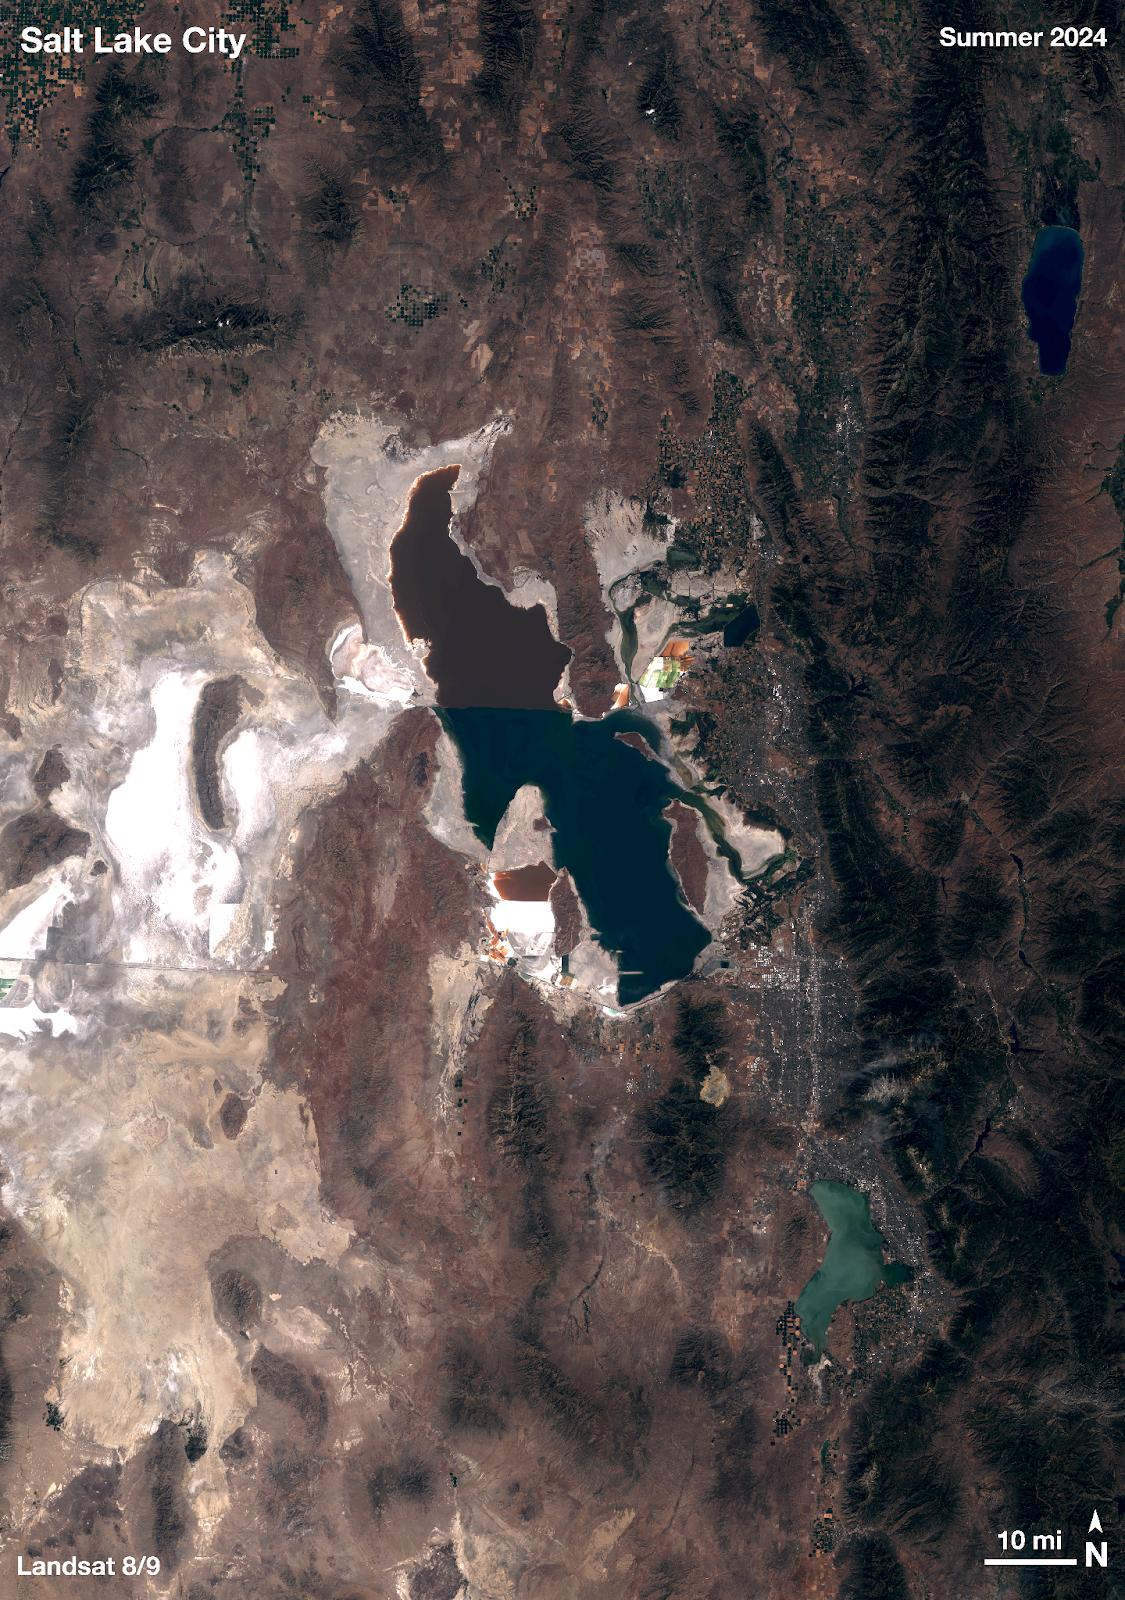
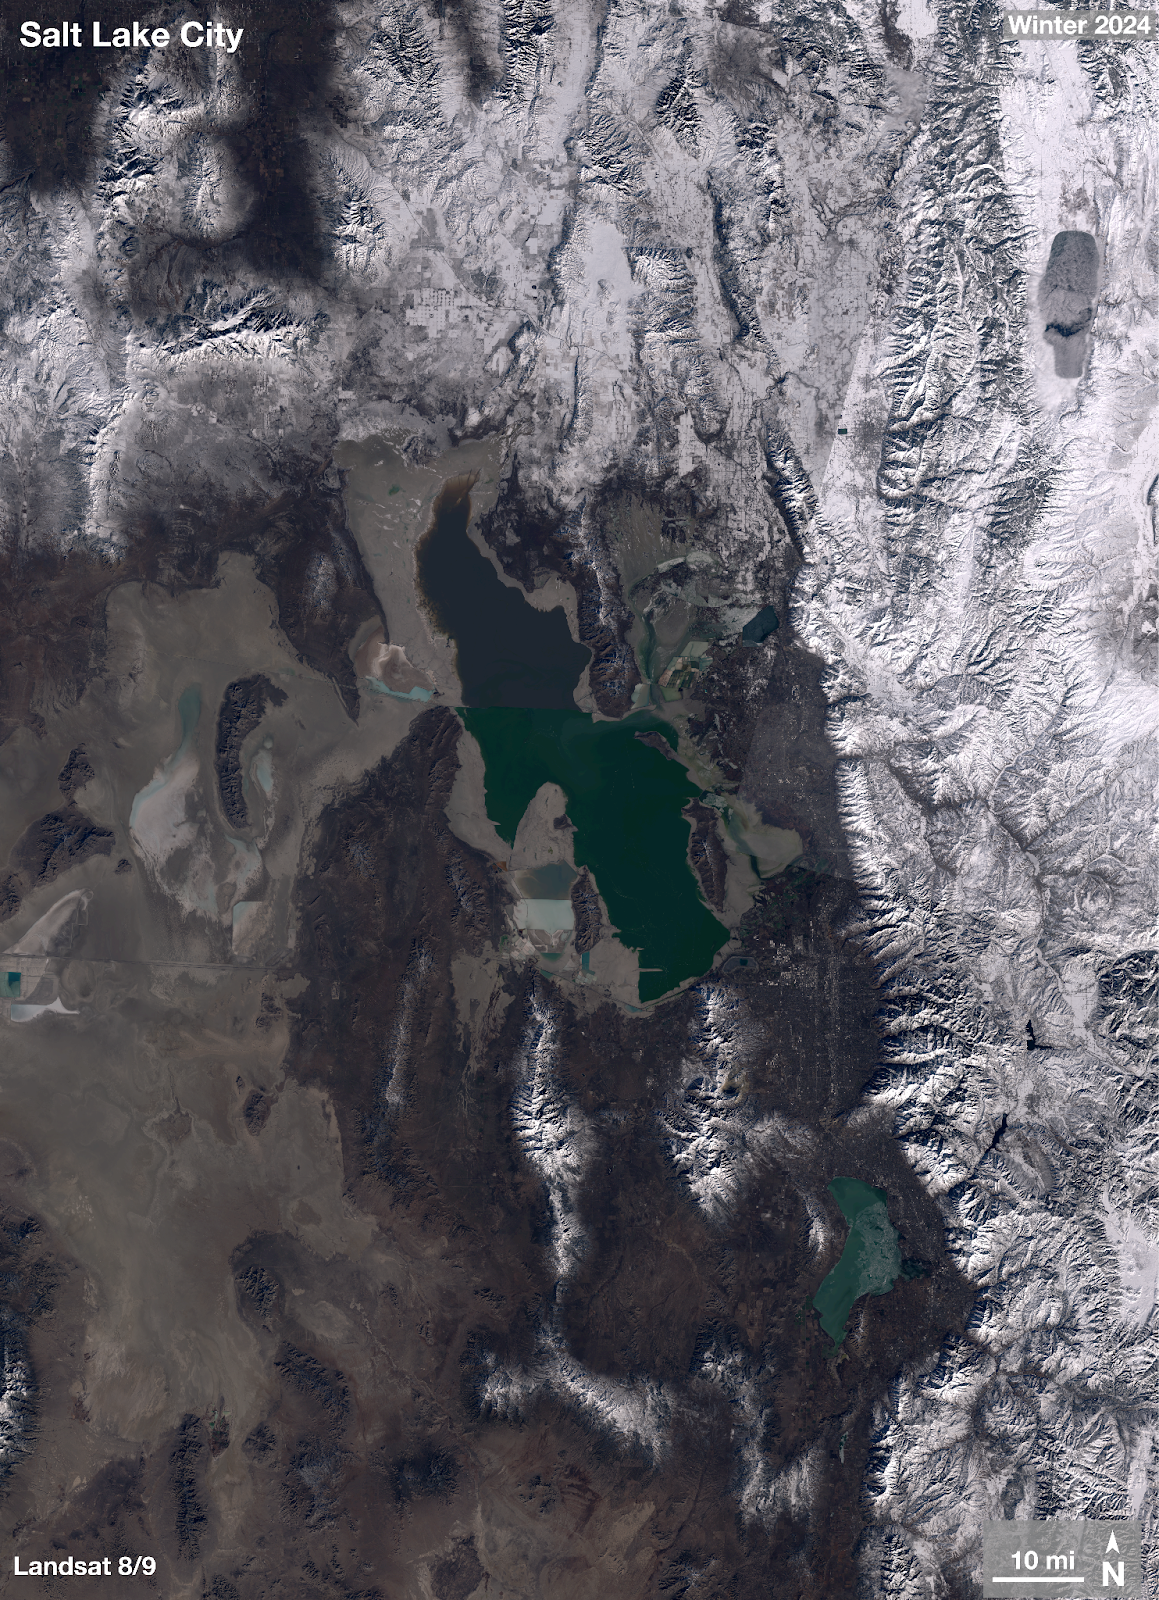
Made by Brigitte Montminy
Brigitte Montminy was a Climate Interpretation Intern working with Earth to Sky from August 2024 to May 2025. With a Bachelor’s degree in Astrophysics and a Master’s degree in Climate & Society from the Columbia Climate School, she is a science nerd with a specific love for maps. From mapping Jupiter’s polar clouds to Earth’s beauties, Brigitte is a fan of all types of maps. She is also currently working as a Climate Media Specialist at The YEARS Project, putting out a weekly newsletter and action toolkit.
Resources:
-
Earth to Sky Images | Landsat Science → collection of Landsat mosaics made for ETS
-
Creating a Landsat Image Using Photoshop w/ Mike Taylor | ETS Webinar (must be signed in)
-
Storytelling with Satellites - Landsat - Hawaiʻi Island w/ Ginger Butcher | ETS Webinar (must be signed in)
-
Creating a Landsat Image | NASA Landsat Science → great tutorial showing how to make a natural- or false-color Landsat image (note: not for mosaics)
-
Landsat Case Studies 2018 | NASA Landsat Science → learn about some of these tangible benefits of Landsat
-
Band Combination Interactive | NASA Landsat Science → online tool to visualize different Landsat band combinations using five different bands: blue, green, red, near-infrared, and short-wave infrared
-
What are the band designations for the Landsat satellites? | U.S. Geological Survey
-
What is the naming convention for Landsat Collections Level-1 scenes? | U.S. Geological Survey
- Landsat 8 Swath Animation | U.S. Geological Survey