Observations
Scientists use many different tools to study present climate.
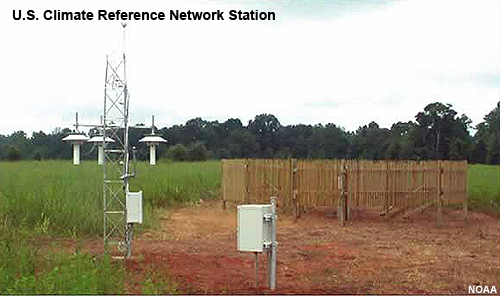
Surface observations: Three main climate centers—NASA, NOAA, and the University of East Anglia in the United Kingdom—each assess data from surface monitoring stations and calculate global average temperatures. While their methods differ, as do some of the finer details of their results (such as rankings of warmest years), they all agree that the 20th century has warmed about 1.4°F (0.8°C).
In addition to temperature, water and moisture measurements also tell us how the climate is changing. In order to evaluate patterns of precipitation and drought, scientists measure rain and snowfall, evaporation, soil moisture, and stream flow.
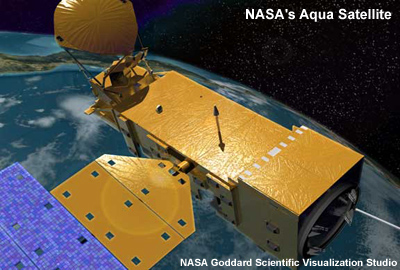
Atmospheric observations: Climate change doesn't just happen at the surface, so scientists look higher up in the atmosphere to see whether temperature, water vapor, clouds, and the sun's energy are changing. Data for these come mainly from satellite or weather balloon measurements.
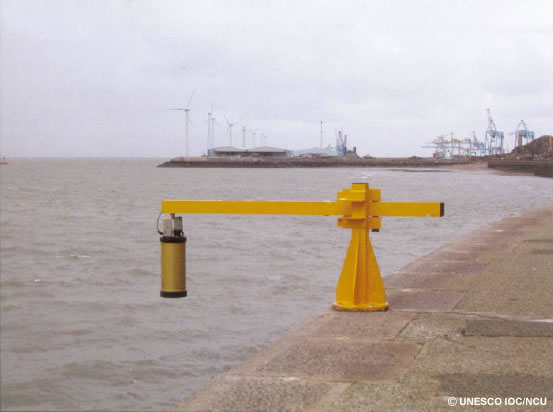
Ocean Observations: To understand sea level change, researchers compare multiple global datasets taken over several decades. They use various tools, including:
- Tide gauges, which measure and record sea level height;
- ARGO floats, a global array of 3,000 drifting profiling floats that measure the temperature and salinity of the upper 6,500 ft (2000 m) of the ocean; and
- Satellites that measure the topography of the ocean and monitor other important factors in sea level changes, including Earth's gravity field, sea surface temperature, and ocean salinity.
Researchers also look to the past to understand sea level. Historical records and radiocarbon dating of different sediments offer important clues about past sea levels, which in turn inform our understanding of present and future sea heights.