Temperatures
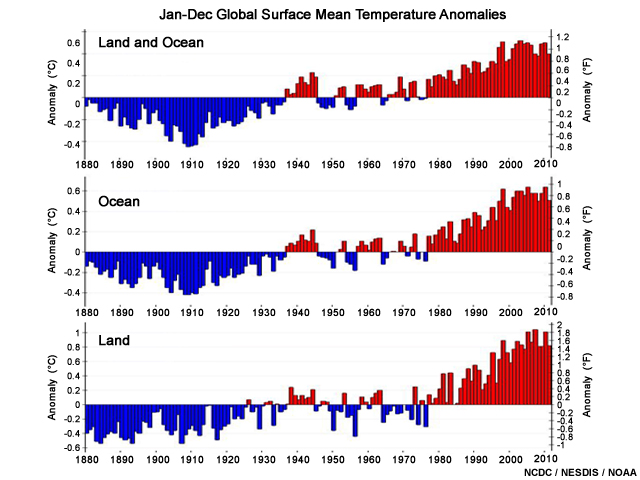
Earth is getting warmer by virtually every measure we know, and the temperature has been well above normal for more than 25 years. Although increases of 1.0-1.6°F (0.6-0.9°C) over the last century or so may not sound very threatening, remember that's a global average. The warming is stronger over land than over oceans and in the higher latitudes than in the tropics.
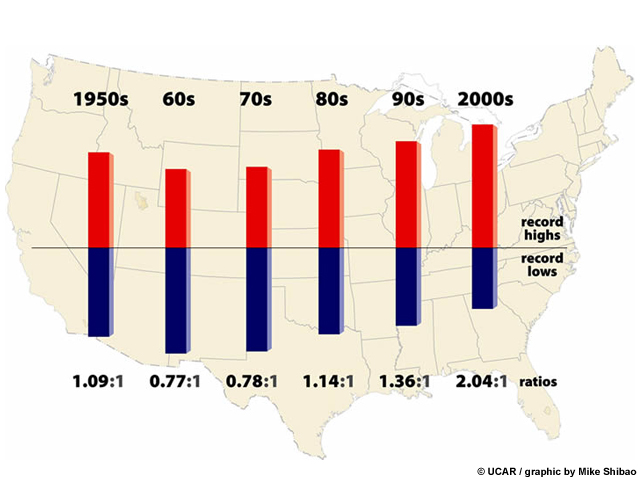
In the United States, this warming is also changing the temperature patterns. Record high temperatures are now occurring more than twice as often as record lows, and similar patterns have been observed across the planet.
What Do You Think?
Question
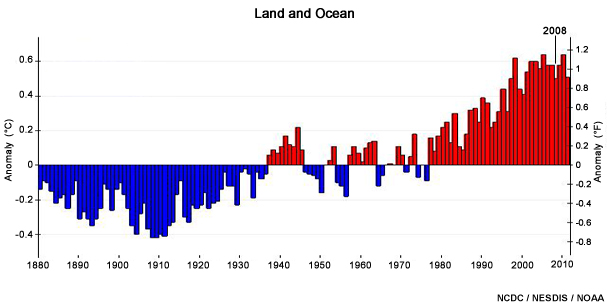
Looking at the graph, what can you conclude about the 2008 temperatures?
The correct answers are a), b) and e).
While 2008 was relatively cool compared to the other years so far in this century, it was still one of the warmest years since 1880.
But why did the temperature decrease in 2008?
Let's look at the global map of surface temperature anomalies for the year.
Notice that much of the world (and especially the Arctic) was warmer than normal (red and orange colors), although the U.S. was fairly close to normal. This illustrates the idea that you can't just look at the weather in one area—you need to see the picture over the entire planet.
Note also the large pool of cooler (blue and green) temperatures in the Pacific Ocean. These lower temperatures reflect a strong La Niña pattern, a naturally occurring oscillation of tropical ocean temperatures that also shape weather patterns. So how did the 2008 La Niña affect the picture?
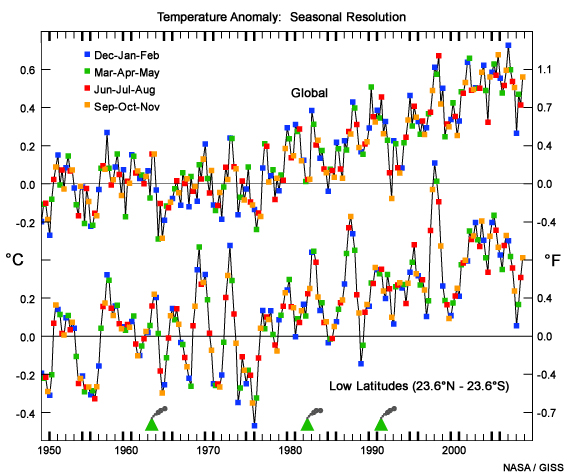
Looking at the seasonal temperatures, we can see that the La Niña cooling cycle was strongest in the low latitudes and that it bottomed out in the winter (December 2007 through February 2008). Once the La Niña pattern relaxed, temperatures bounced upward again. This is a good example of natural climate variability superimposed on the global warming signal.