How Do We Know?
The Experts
IPCC
Figuring out what influences climate, how it has changed in the past, whether it's changing now, and how it might affect our future has required the expertise of thousands of scientists and other experts from dozens of fields who were brought together in one body: the IPCC.
Since it was formed in 1988, the IPCC's purpose has been to bring together the experts who can provide decision makers and others with an objective source of information. It does not, however, conduct any research itself. The IPCC's Assessment Reports (issued in 1990, 1995, 2001, and 2007) also don't tell us what to do. They discuss options, but leave prescribing policies for dealing with climate change up to individual nations.
But who are the experts involved in the IPCC and what do they do? These specialists (more than 2,000 of them) represent about 140 countries, a variety of fields, and a range of views. Their function is to assess the latest peer-reviewed literature and to achieve consensus about where the weight of the evidence points and where uncertainties lie.
Remember that this means they are looking at papers that have already been reviewed in depth by other experts before the articles were published in a scientific journal. For the 2007 Report, they examined 29,000 data sets. The assessment also included computer modeling to determine the cause of climate change and to predict future impacts.
Levels of Confidence | |
| Terminology | Degree of confidence in being correct |
| Very high confidence | At least 9 of 10 chances of being correct |
| High confidence | About 8 of 10 chances |
| Medium confidence | About 5 of 10 chances |
| Low confidence | About 2 out of 10 chances |
| Very low confidence | Less than 1 out of 10 chance |
Likelihood Scale | |
| Terminology | Likelihood of occurrence/outcome |
| Virtually certain | >99% probability of occurrence |
| Very likely | >90% probability |
| Likely | >66% probability |
| About as likely as not | 33-66% probability |
| Unlikely | <33% probability |
| Very unlikely | <10% probability |
| Exceptionally unlikely | <1% probability |
The IPCC was very careful in its use of language. Phrases such as "likely" and "low confidence" have very specific meanings. For example,
Similarly, expressions of the likelihood of something occurring are also well-defined:
So when the IPCC states, "Changes in snow, ice and frozen ground have with high confidence increased the number and size of glacial lakes," the phrases mean that the scientists believe there is an 8 out of 10 chance the statement is correct.
Other Experts
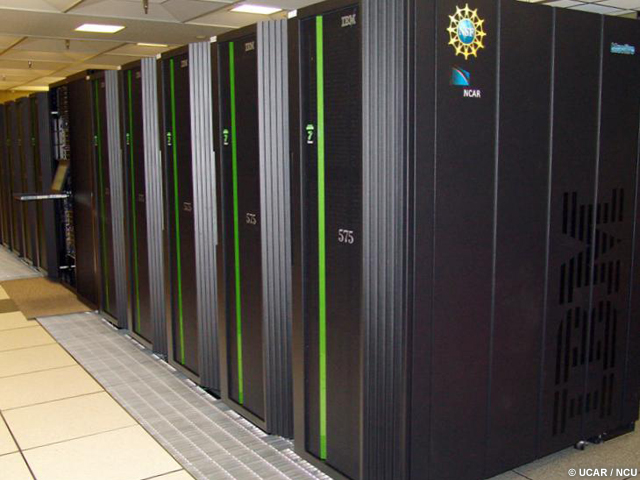
The IPCC isn't the only group that has taken up the question of climate change. In the U.S., many government agencies (such as the National Oceanic and Atmospheric Administration [NOAA], National Aeronautics and Space Administration [NASA], and Environmental Protection Agency [EPA]), non-profits like the National Center for Atmospheric Research (NCAR), and universities have groups that work on climate change.
The U.S. Climate Change Science Program is tasked with integrating federal research on climate and global change and has produced a number of reports on climate. In addition, the National Academy of Sciences (NAS), which was created in 1863 to provide independent advice to the U.S. government on scientific and technological issues, has also worked on the topic. All of these groups support the major conclusions of the IPCC.
Tools: Data
Paleoclimate
If you want to know what is changing climate now, it's helpful to understand what has changed it in the past. The record of the Earth's past climate comes from many different data sources
- Geology
- Atoms (called radionuclides) produced by cosmic rays
- Fossils
- Lake and ocean sediments
Other techniques that the general public is more familiar with include:
- Ice cores
- Tree rings
- Coral growth patterns
- Climate models
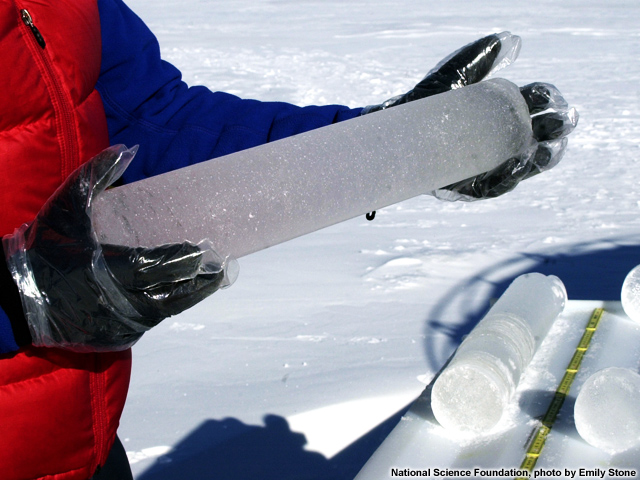
Ice cores: Ice cores drilled from deep within ice sheets or glaciers give us our longest look back in time—as far back as 800,000 years, so far. Analyses of the water molecules, air bubbles, and material such as ash and dust can provide information on local temperatures, greenhouse gases, volcanic eruptions, and other factors that influence climate.
Tree rings: Tree ring analysis (dendrochronology) looks at changes in the thickness of annual growth rings that are determined by seasonal and climatic variations of temperature, precipitation, or both. Dendrochronology is a very useful tool for looking at climate over the last 7,000 years or so. For example, tree rings have shown poor growth in years when ice cores indicate large volcanic eruptions, which shroud the sun and cool the earth.
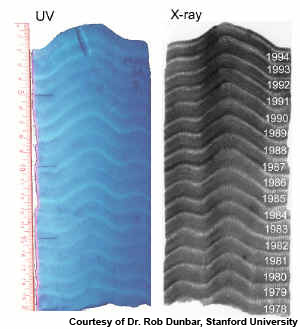
Coral growth patterns: The growth rate and density of coral skeletons also vary with temperature and other environmental conditions, so their growth patterns can be analyzed much like tree rings. The chemical composition of the coral in a particular ring provides information about sea surface temperatures, salinity, runoff, and upwelling.
Climate models: Climate models are used to test explanations for past and future climate changes. For example, a model run by NCAR looked at four periods— a warm period 250 million years ago, one of abrupt warming 55 million years ago, a glacial period about 21,000 years ago, and the Little Ice Age (about 500 years ago). Scientists found that the models produced changes similar to what actually happened. This gives scientists more confidence about using models to make future estimates.
Observations
Scientists use many different tools to study present climate.
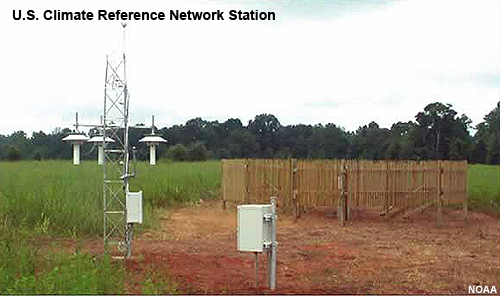
Surface observations: Three main climate centers—NASA, NOAA, and the University of East Anglia in the United Kingdom—each assess data from surface monitoring stations and calculate global average temperatures. While their methods differ, as do some of the finer details of their results (such as rankings of warmest years), they all agree that the 20th century has warmed about 1.4°F (0.8°C).
In addition to temperature, water and moisture measurements also tell us how the climate is changing. In order to evaluate patterns of precipitation and drought, scientists measure rain and snowfall, evaporation, soil moisture, and stream flow.
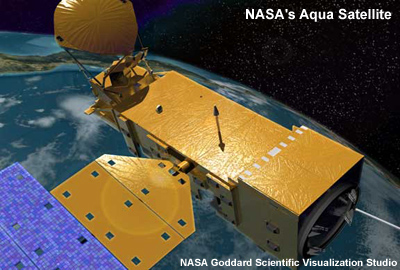
Atmospheric observations: Climate change doesn't just happen at the surface, so scientists look higher up in the atmosphere to see whether temperature, water vapor, clouds, and the sun's energy are changing. Data for these come mainly from satellite or weather balloon measurements.
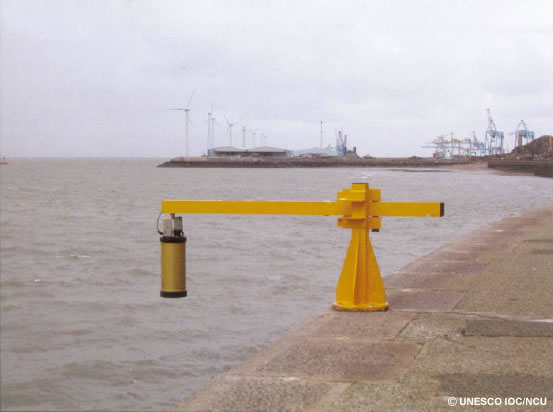
Ocean Observations: To understand sea level change, researchers compare multiple global datasets taken over several decades. They use various tools, including:
- Tide gauges, which measure and record sea level height;
- ARGO floats, a global array of 3,000 drifting profiling floats that measure the temperature and salinity of the upper 6,500 ft (2000 m) of the ocean; and
- Satellites that measure the topography of the ocean and monitor other important factors in sea level changes, including Earth's gravity field, sea surface temperature, and ocean salinity.
Researchers also look to the past to understand sea level. Historical records and radiocarbon dating of different sediments offer important clues about past sea levels, which in turn inform our understanding of present and future sea heights.
Tools: Models
What They Are
Global climate models simulate the chemical and physical processes that drive Earth's climate. These models are used to study Earth's past climate changes, and they are an important tool to check our understanding of how climate processes work. Models are also the only way we have to evaluate how the climate might change in the future. In other words, they are a big part of how we come to understand climate science.
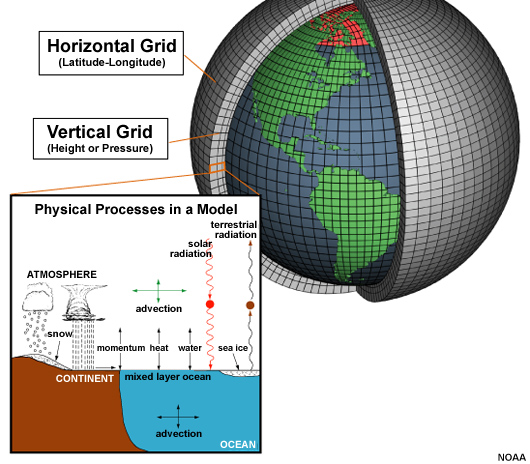
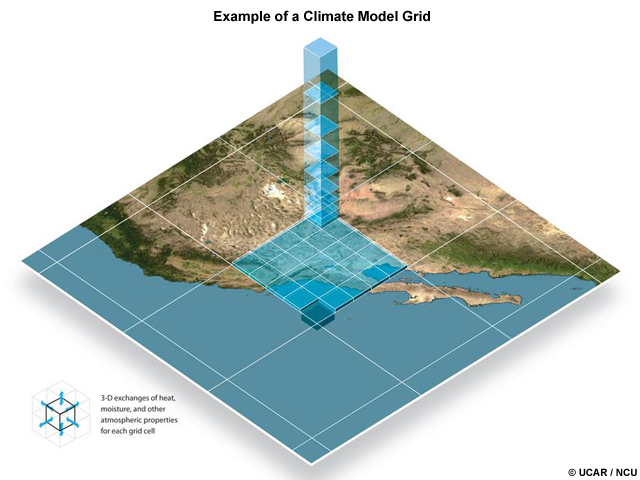
Much like the models that broadcast meteorologists use to issue weather forecasts, climate models simulate Earth's climate system with a 3-dimensional grid that extends through the land, ocean, and atmosphere. The grid may have 10 to 60 different levels in the atmosphere and surface grid spacings of about 60 by 90 miles (100 by 150 km)—the size of Connecticut. The models perform trillions of calculations that describe changes in many climate factors in the grid.
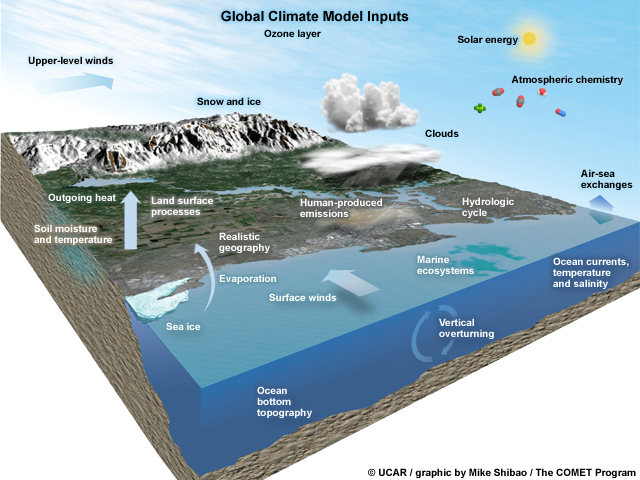
The models project possible climates based on scenarios that cover a range of assumptions about global population, greenhouse gas emissions, technologies, fuel sources, etc. The model results provide a range of possible impacts based on these assumptions.
In the 1960's when climate science was in its infancy, these models were relatively limited. New components and better resolution in the decades since have greatly improved the models. However, it's worth noting that even early on, the relatively crude models already showed many of the features that have been observed today, such as the greater warming in higher latitudes relative to lower latitudes.
Uncertainties
Climate modelers are the first to point out that the models are imperfect, so it's reasonable to ask what the uncertainties are and whether, given those, we can trust models to provide useful predictions. Their main shortcomings are:
- Limited observations
- Incomplete understanding of climate processes and their interrelationships
- Imperfect model representations of the processes
- Relatively large grid boxes that don't represent smaller terrain features
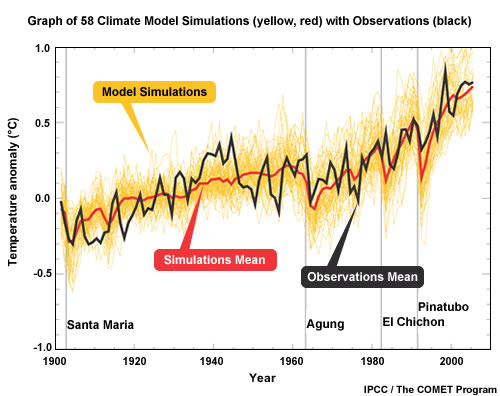
To determine whether climate models are useful and where problems might exist, scientists run tests to see how well the results match actual past temperature changes.
If the two don't match, then scientists have to figure out if there's a problem with the observations or with some component of the models. For example, a few years ago some of the satellite data did not show parts of the atmosphere warming at the same rate as models did. Eventually an error in the satellite data calculations was found, and now the two are in agreement.
Climate and Weather Models
A common critique of climate predictions is, "If weather model forecasts aren't reliable more than a week out, how can models predict climate decades in the future?" While weather and climate models are based on similar physics, they are not predicting the same thing. Weather forecasts look at the day-to-day changes on a local level, while climate predictions are focused on longer term processes and global or regional scales. Subtle chaotic atmospheric variations make short-term weather forecasts difficult beyond 8-10 days. Climate models deal with the longer-term influences of the sun, oceans, land, and ice on the atmosphere. Predicting a temperature at a particular place at a particular hour is a different problem than projecting an average temperature in a large region or over the entire globe and over a year, decade, or century.
The bottom line is that models have shown a reasonably consistent picture of warming and its causes.
Regional Downscaling
Relating global climate change projections to regional, or even local, effects is critical for making policy and investment choices that can reduce the potential for future adverse climate impacts. However, it is not simply a matter of running a global climate model and looking at the results at a specific location.
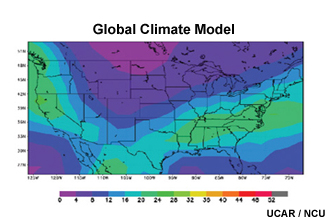
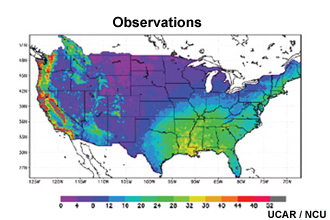
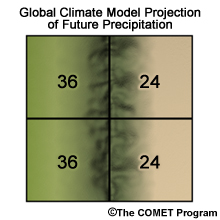
While global models are useful for understanding broad features of climate change, their resolution is too coarse to answer questions about smaller regions. In other words, the points at which a global model makes calculations are too far apart to see topographical features that often determine the finer structures in weather patterns. So, for example, the model results (top image) get the broad features correct, but miss many details that show up in the observations (bottom image). This is particularly true in the western U.S. where there is more varied topography. Global climate models can also miss other influences, such as those caused by the interface between sea and land.
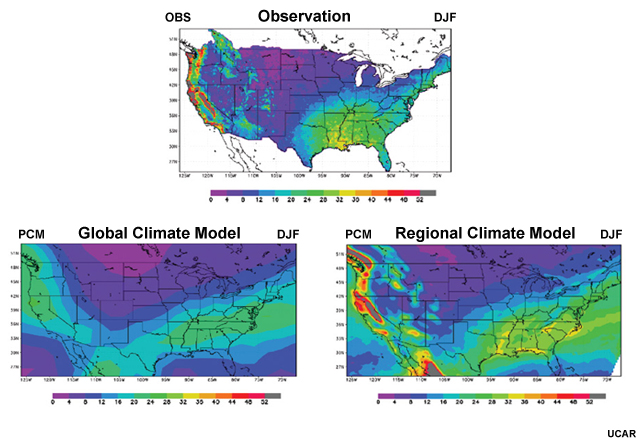
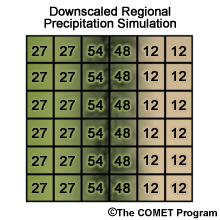
A technique known as "downscaling" takes global model output and uses it to provide information closer to the local level. Scientists use two basic methods: dynamical downscaling and statistical downscaling. So, in this example, a regional climate model (an example of dynamical downscaling) gives results that produce more realistic local-scale features that better replicate the observations.
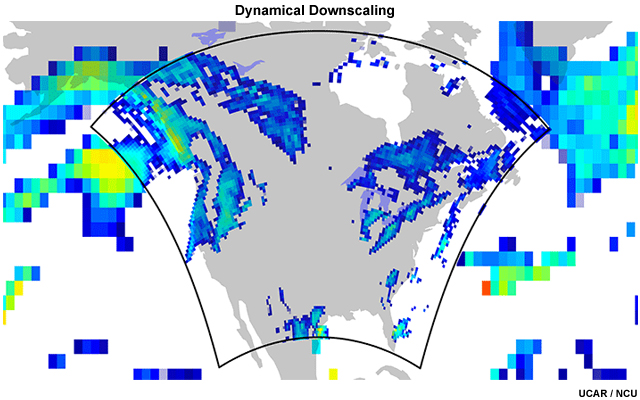
In dynamical downscaling, scientists nest a regional climate model (shown in the center of this figure) within the output of a larger global-scale climate model (indicated by the larger pixels on the edges). The nested regional climate model takes meteorological, oceanic, and land-surface data generated by the global climate model and makes a regional projection. Because regional models have a more limited scale, they can be run at much higher resolution (as shown by the smaller pixel sizes) than can be achieved by global models.
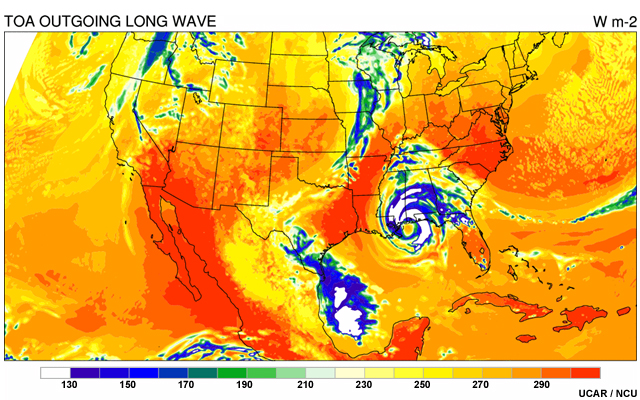
Nested regional climate models are improving every year and can even produce realistic depictions of weather features, such as this simulation of a possible future hurricane hitting the Gulf Coast. Some researchers downscale the results further by also using "weather-scale" models that can simulate individual storms. While these results are not intended as forecasts years in the future on a specific day, the models' ability to produce realistic weather indicates they can simulate features that affect broader weather patterns. Researchers then use simulations of specific events to establish statistical trends in such things as frequency of hurricanes per year over a multi-decadal period.
However, dynamical downscaling has its challenges. For example, small errors in the global climate model may amplify inside the nested domain and become major errors. Another weakness is the lack of productive cross-talk between the regional climate model and the global one. The regional model can theoretically provide the global one with feedback, increasing overall accuracy, but this also increases the computing requirement substantially.
The second approach, statistical downscaling, takes advantage of statistical relationships between regional climate and global climate. That is, scientists may notice that when the global climate does A, the regional climate responds by doing B some percentage of the time.
By developing a long list of such statistical associations, scientists can input the conditions projected by global models into regional statistical downscaling systems to predict how the regional climates will respond to future global temperatures or greenhouse gas concentrations.
Attribution Studies
Is a particular weather event—such as a tornado outbreak or a record heat wave—caused by natural variability or global warming? There are no definitive answers yet, but scientists are beginning to provide insight into the effect climate change might have on the chances of an extreme event occurring.
Using computer models and sophisticated statistical techniques, researchers in the field of attribution science are able to estimate the odds that global warming increased (or decreased) the chances for certain extreme events.
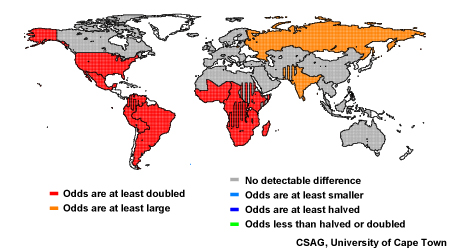
The science of attributing extreme water and weather events to climate variability and change is relatively new. Several recent case studies have shed light on unusual events such as the 2003 European heat wave and the 2010 Russian heat wave. And, as seen in this image, some scientists are even producing forecasts of the changes in the odds of occurrence for hotter, colder, wetter, and drier events.
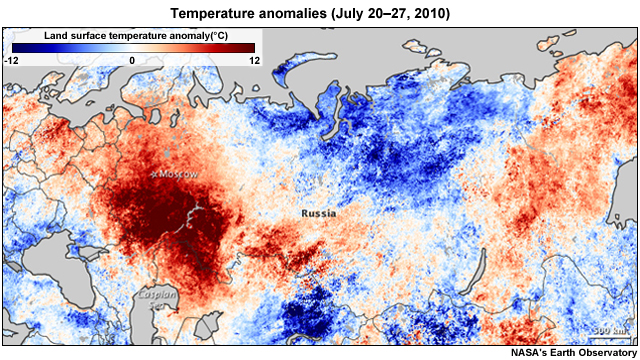
In the case of the 2010 Russian heat wave, researchers found the magnitude of that event was primarily caused by natural factors. Other scientists, who used a different approach, found that the risk of these types of events in western Russia has increased greatly due to global warming. It appears that, even if natural factors were the main cause of this particular weather extreme, the added strength produced by climate change pushed it to a new and dangerous level.
These early studies show promise, but much more work needs to be done to expand the regional areas and the types of weather events for which these studies are conducted. Researchers hope that improvements in attribution techniques will eventually lead to developing improved early warning capabilities.