Why Should We Care?
Only a Few Degrees?
Why It Matters
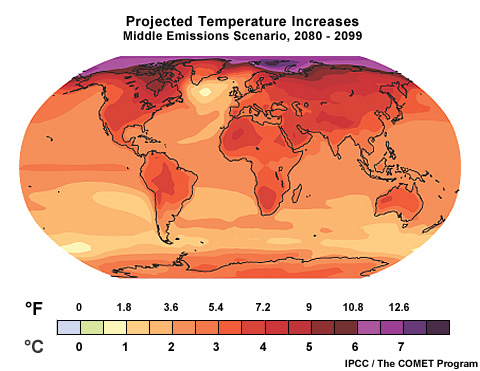
Climate Change 2007: The Physical Science Basis. Working Group I Contribution to the Fourth Assessment Report of the Intergovernmental Panel on Climate Change. Figure 10.8, Cambridge University Press.
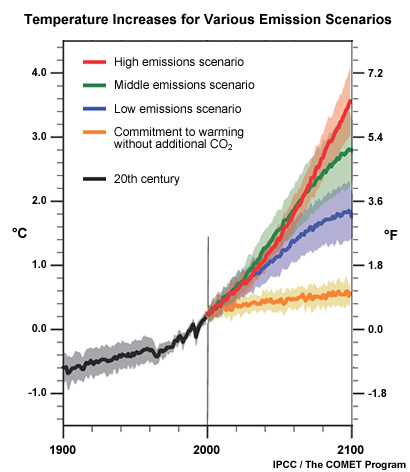
Global average temperatures are expected to increase by about 2-13°F (1-7°C) by the end of the century. That may not sound like a lot, so what's the big deal? The problem is that small changes in global average temperature can lead to really large changes in the environment.
Only a few degrees have made the difference between ice ages, temperate periods, and a hothouse Earth with green poles. During the last ice age, global average temperatures were only 7-13°F (4-7°C) colder, but ice ploughed as far south as Illinois. About 125,000 years ago, average temperatures were only a degree or so warmer than today, but sea levels eventually rose as much as 20 feet (6 meters).
Small changes in the global average temperature also mean heat waves get hotter and droughts get drier. This happens thanks to small changes in the way air and water circulate around the globe. The resulting modifications to the environment can have large consequences for ecosystems. For instance, during the wetter and cooler climate of the last ice age, the Great Basin of California was filled by a great lake ringed with pine forests. When the climate became warmer and drier at the ice age's end, the lake dropped 500 feet and lost 90% of its surface area. The pine forests became sagebrush desert. Such changes in precipitation could be just as important, or even more important, than temperature increases for many parts of Earth.
Climate Change 2007: The Physical Science Basis. Working Group I Contribution to the Fourth Assessment Report of the Intergovernmental Panel on Climate Change. Figure 10.4, Cambridge University Press.
These kinds of effects are not temporary, either. The climate is like a large ship: once it starts turning, it is hard to stop. Whatever the new direction is, it will affect your children, your grandchildren, and many generations after.
What will a changing climate mean for us in the future? Scientists make the best assumptions they can using models to project what might happen. But we don't know for certain what will happen or when because we don't know what choices people will make about changing energy sources, limiting population growth, preserving forests, etc. Some impacts are more certain than others, some will occur sooner and others later, and some will affect developing nations more than wealthier ones.
Weather in a Changing Environment
Climate and weather events now take place in a world that is different from the one our grandparents knew. The average temperature of the atmosphere is warmer. Oceans are also heating up, and polar ice is melting, as are many glaciers. Heavy bouts of rain and snow are becoming more frequent, with longer dry spells in between. Ecosystems are also changing. While day-to-day weather generally remains familiar, it plays out against a backdrop of change, and the mix of weather is slowly evolving as some events become more likely and others less common.
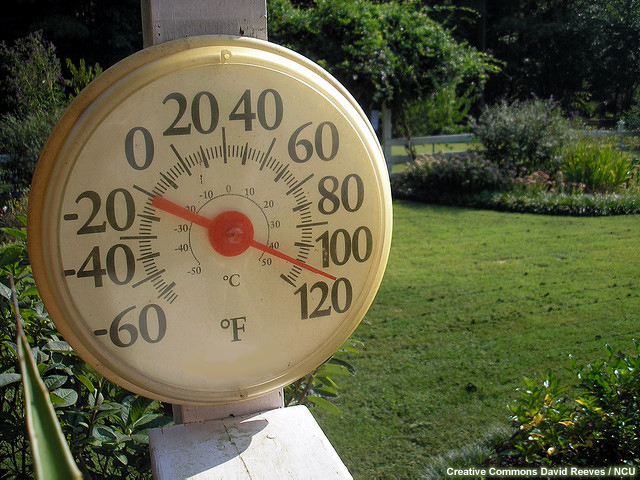
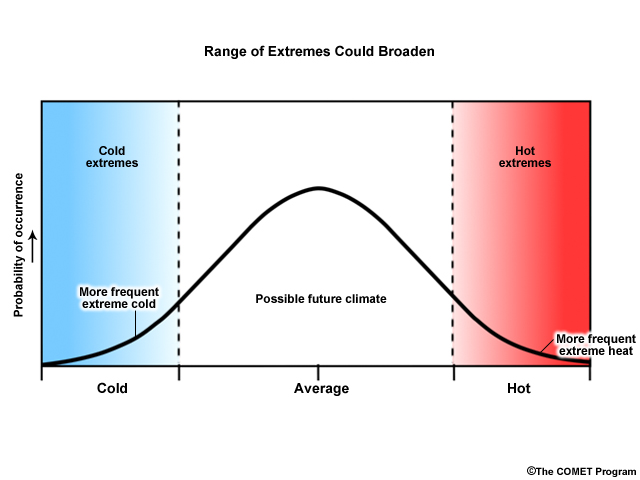
Extreme weather is a bit relative. For example, a hot day in Wyoming would be considered a mild one in Arizona. And we don't generally notice changes in climate because most weather falls within the range of what is expected. It is mainly the extreme events that get our attention—events that are outside our normal experience and that often inflict human suffering. So how might global warming affect climate extremes and extreme weather? There are several possible ways. Let's look at temperature as one example.
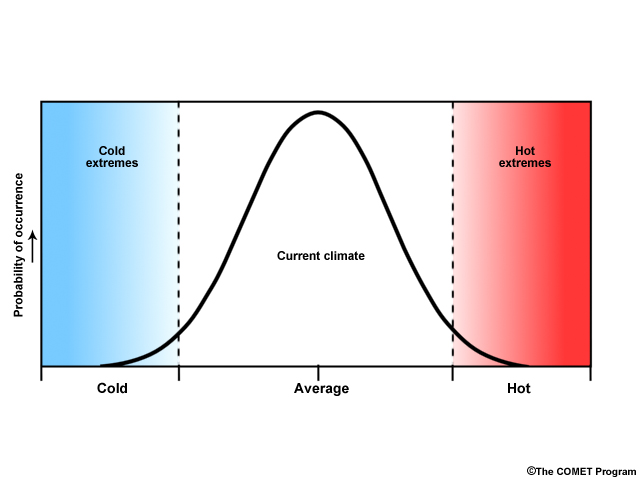
The normal distribution of temperature can be thought of as a bell-shaped curve like this, with the majority of the observations in the middle, but with rare events of extremely cold or extremely warm temperatures at the ends.
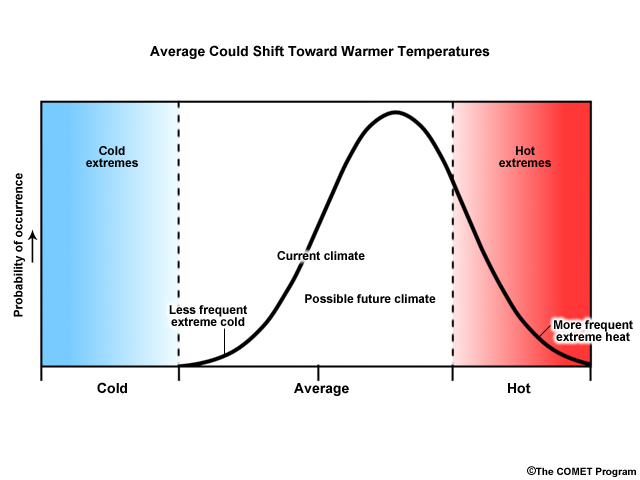
Global warming could shift the distribution to the right—decreasing the frequency of very cold weather events, but greatly increasing the occurrences of hot weather.
Another possibility is that climate change increases the variance in the distribution of temperature—in other words, it increases the range of possibilities at both ends of the distribution.
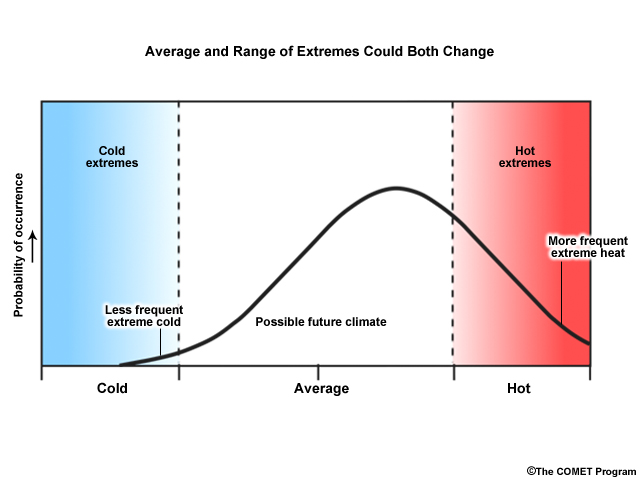
Or climate change could result in a combination of the two types of changes. We don't know exactly how the distribution of temperature will change, but most climate scientists strongly agree that, on the average, the global climate will continue to warm. However, the effects of this warming in specific locations are less known.
Hotter Summers/Warmer Winters
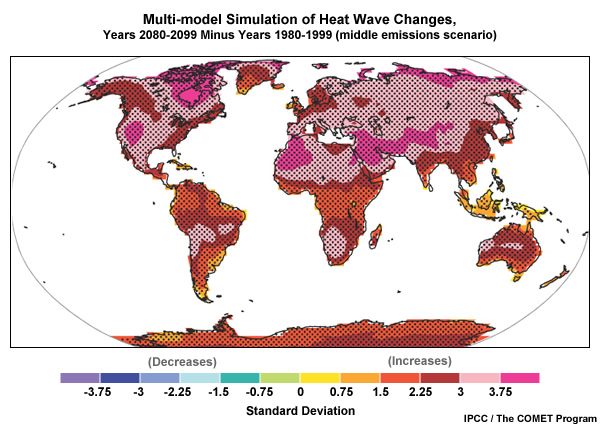
Climate Change 2007: The Physical Science Basis. Working Group I Contribution to the Fourth Assessment Report of the Intergovernmental Panel on Climate Change. Figure 10.19 (b), Cambridge University Press.
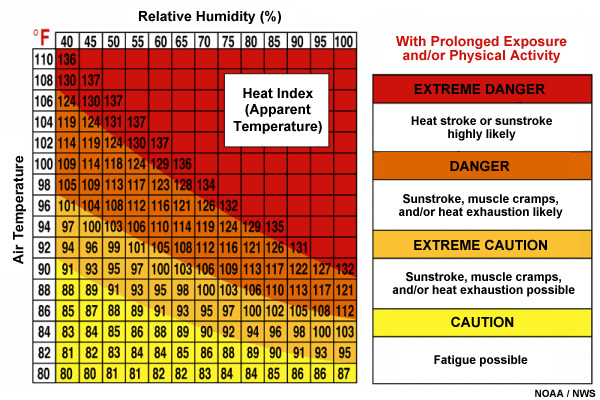
Of course, there will always be natural variability, with some places and some years warmer or cooler than average. In general, however, summers will get hotter, not only because of higher temperatures but also because humidities will increase, raising the heat index, which is a measure of the effects of heat plus humidity on humans. A warming trend on top of natural variability means that temperatures will cross today's heat thresholds more often.
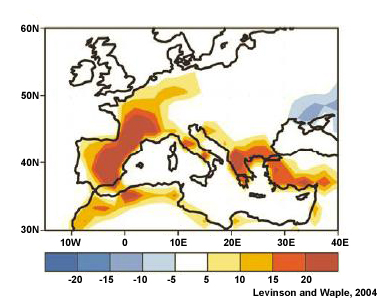
Number of days with temperatures hotter than normal during the 2003 European Heat Wave.
For example, the summer of 2003 was the warmest in at least the past 500 years in Europe and resulted in over 70,000 deaths. Researchers wanted to know if this heat wave was simply an extremely unusual natural event or whether climate change created an environment that altered the pattern of natural variability. Using a climate model, they analyzed the probabilities of exceeding the 2003 seasonal mean temperature under 2003 conditions, including the build-up of greenhouse gases from human activities. They then ran the model again without those greenhouse gases. Their conclusion is that global warming probably at least doubled the chances of the heat wave. Models predict that in many places, an extreme heat event that we see once every twenty years today will happen once every three years by the middle of this century, and even more frequently by century's end.
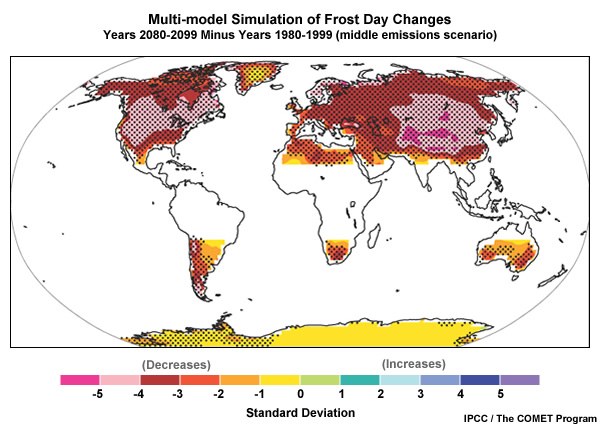
Climate Change 2007: The Physical Science Basis. Working Group I Contribution to the Fourth Assessment Report of the Intergovernmental. Panel on Climate Change. Figure 10.19 (a), Cambridge University Press.
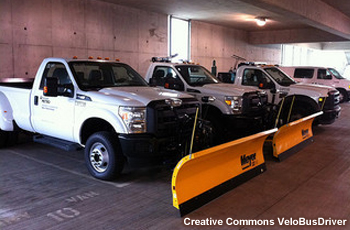
On the plus side, winters will be warmer in many places, reducing heating bills. And the number of days with frosts is likely to decrease. On the downside, it means more snow may fall as freezing rain, making ice more of a problem for motorists, pilots, and seniors.
Droughts and Floods
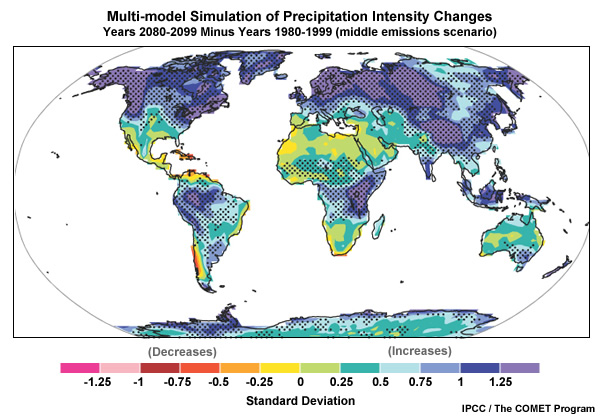
Climate Change 2007: The Physical Science Basis. Working Group I Contribution to the Fourth Assessment Report of the Intergovernmental. Panel on Climate Change. Figure 10.18 (b), Cambridge University Press.
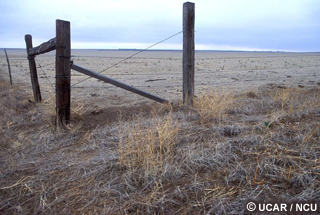
Because a warmer planet will boost evaporation and change atmospheric moisture circulation, many dry areas will become drier and wet areas wetter. In North America, on average, precipitation is likely to be less frequent but more intense when it does fall.
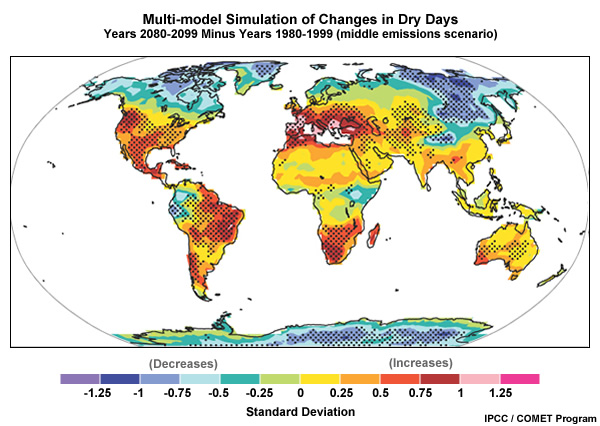
Climate Change 2007: The Physical Science Basis. Working Group I Contribution to the Fourth Assessment Report of the Intergovernmental. Panel on Climate Change. Figure 10.18 (d), Cambridge University Press.
This may mean that the American Southwest becomes drier. Indeed, we have already begun to see these trends in the past few decades. And along with increased droughts comes an increased potential for wildfires.
Sea-Level Rise
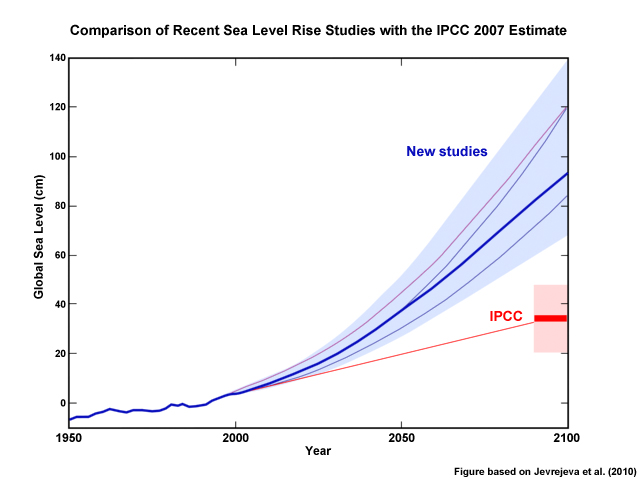
The oceans will continue their rise in the coming century. In their 2007 report, the IPCC estimated that the global average sea level will rise by about 9 to 20 in. (22-50 cm) by 2100 (relative to 1980-1999) under a range of greenhouse gas emissions scenarios. It is important to note that these estimates assumed that melting from Greenland and Antarctica would continue at the same rates as observed from 1993-2003. However, new research suggests that the IPCC predictions may be too low, and that sea level rise could be closer to 3 ft (1 m).
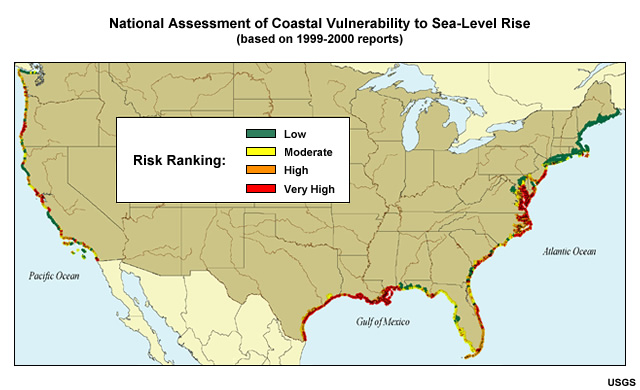
If seas rise two feet (0.6 meters), the United States could lose 10,000 square miles (26,000 square kilometers) of land surface, mostly on the Gulf and Atlantic coasts. If they rise three, they will inundate Miami and most of coastal Florida.
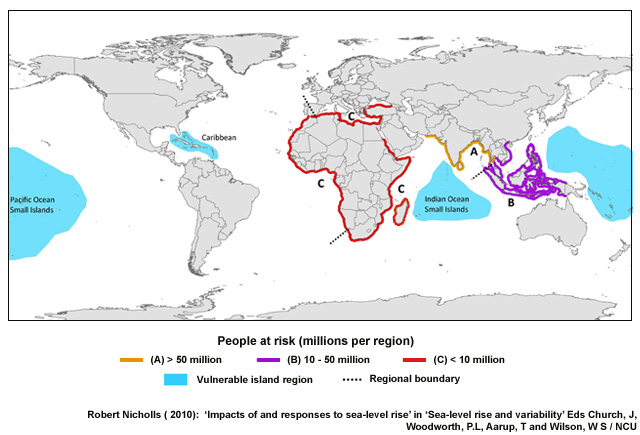
This map highlights regions that are most vulnerable to coastal flooding based on a scenario for the 2080s that assumes a global sea level rise estimate of 18 in. (45 cm). Nearly half of the world's population lives in low-lying coastal areas, and continued population growth along coasts increases vulnerability from sea-level rise, storm surge, and flooding.
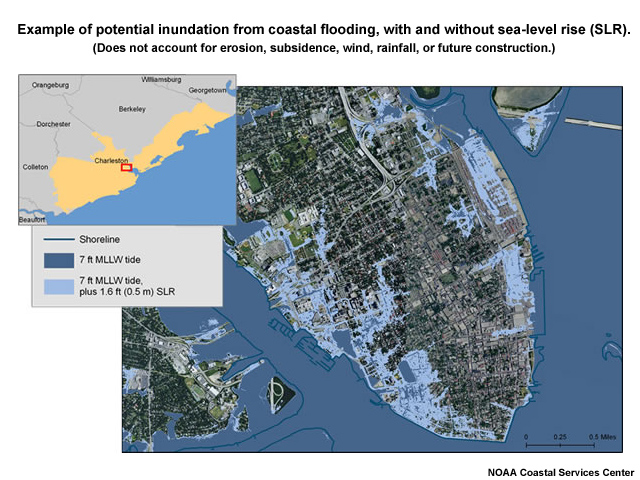
Even a small amount of sea level rise can produce major changes for coasts. In low-lying areas, a foot and a half of vertical rise (0.5 m) can cause inundation far inland, as illustrated in this image, which shows how Charleston, South Carolina would be impacted by that magnitude of sea level rise.
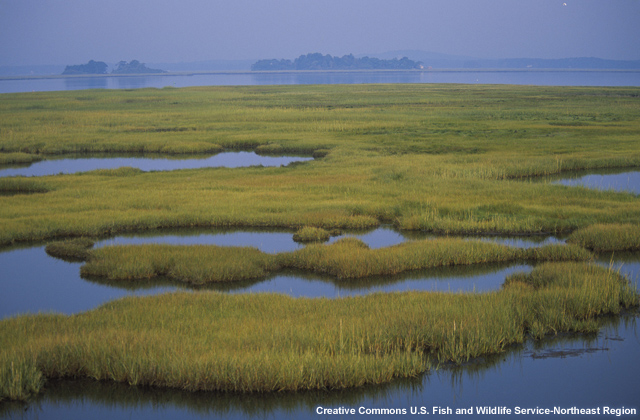
Other effects of sea level rise can include saltwater intrusion into freshwater aquifers that provide drinking water and loss of coastal wetlands and their ecosystems. One estimate projects 17-43% of U.S. wetlands could be submerged, of which more than half would be in Louisiana. Though new wetlands will form farther inland, their total area will probably be reduced, which would put New Orleans and other coastal cities at even greater risk from hurricane storm surge.
Extreme Weather
Extreme weather events cover the spectrum from long-term droughts to short-lived tornadoes. When talking about the effect of climate change on different kinds of extremes, scientists have more confidence for some than others. But we do know that increasing greenhouse gas emissions are affecting temperature and precipitation patterns, which are the main drivers of weather events. So it makes sense that these changes can also alter the odds of an extreme event happening.
What Do You Think?
Question
How do you think hurricanes are likely to be affected by global warming in the future?
The correct answer is c).
Answer: This actually is a subject of considerable scientific debate. Scientists are not sure whether the frequency of hurricanes will change, but they think that those that do form will likely be more intense with stronger wind speeds and heavier rain (answer c).
Studies suggest that for every 1.8°F (1°C) increase in tropical sea surface temperatures, core rainfall will increase by 6-18%, and surface wind speeds of the strongest hurricanes will increase 1-8%. Storm surge levels are also likely to increase. However, some studies suggest that vertical wind shear increases may reduce hurricane activity, at least in some areas.
We don't have enough data on tornadoes to determine whether their frequency or severity is changing. And global climate models can't currently simulate features as small as these storms.
While winters will be warmer overall, when storms do occur, they will likely produce more snowfall, stronger winds, and higher waves, although these effects may vary with location.
Of course, extreme weather events can have some positive effects. The warm winter of 2011-2012 in the U.S. resulted in lower heating bills, and many communities also saved by not needing snow removal services.
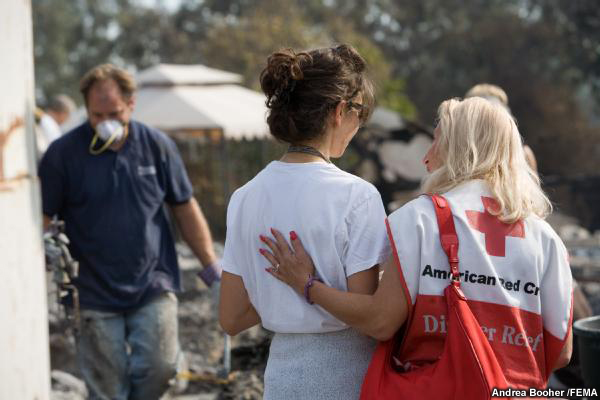
Often, it is an individual's or community's vulnerability to the adverse effects of extremes that largely determines whether a particular event is a disaster or not.
Other Effects
Ocean Ecosystems
As the oceans absorb more carbon dioxide, the chemistry of the ocean changes, putting many sea creatures at risk. The IPCC projects that by 2100 the pH of the ocean will drop to its lowest point in at least 20 million years. This means that tiny creatures at the bottom of the ocean's food chain will struggle to make their calcium-carbonate shells. Nearly every sea creature from plankton to whales would be directly or indirectly affected. If the ocean food chains collapse, many people in the world who depend on fish for food will go hungry, and seafood may become a delicacy that only the wealthy can afford.
Health
Here, too, the news is not good: people are already suffering from climate-related causes and more will be killed or sickened as the planet warms. Death rates spike an average of 6% during heat waves, so heat-induced deaths will probably rise sharply as temperatures increase and heat waves become more prolonged and intense. On the plus side, warmer winters could help reduce flu and other ailments.
As temperatures get milder, ticks, mosquitoes, rodents, and other carriers of disease will expand their range and sicken more people, particularly in developing countries. Here in the United States, dengue hemorrhagic fever, a tropical, mosquito-borne disease, hit for the first time in modern times in 2005 in the Lower Rio Grande Valley. Experts worry that dengue could become widespread in the U.S., and the reappearance of malaria is not out of the question either.
Air pollution will likely worsen, since higher temperatures and humidities will allow more ozone and particle pollution to form and linger longer. This will produce more asthma and deaths from heart and lung disease. One scientist at Stanford estimates there will be 1,000 additional air-pollution-related deaths per year for every 1.8°F (1°C) increase in temperature in the U.S.
More heavy downpours and floods will produce more diseases associated with flooding—like allergic reactions to mold and gastrointestinal disease outbreaks like cryptosporidium. Warmer ocean temperatures also favor the seafaring bacteria that cause cholera.
In the general irritation category, more carbon dioxide also helps plants like ragweed make more allergens and poison ivy make more of its irritating oil.
Economics
Most people will see climate change delivered to them in the form of higher water, energy, and insurance bills. Why? More droughts, higher temperatures, and more extreme weather will require lifestyle alterations ranging from what crops we grow to how we recreate. Climate change expands the range of conditions we need to prepare for, and that preparation costs.
Warmer temperatures will also mean less snow overall at certain latitudes because more will fall as rain, and the snow that does fall will melt faster. The consequences of this are plain to ski resort operators—a shorter, poorer ski season—but it also makes a difference to local water supplies. In some areas, snowpack will melt sooner and more suddenly (as it already is in most western states), and will flow uselessly past reservoirs that are still full during the winter. It also means rivers and streams will flow less during the later, hotter parts of summer. The difference this makes to farmers and ranchers is obvious, but it also affects people living in areas that depend on snow-fed reservoirs for water. There will likely be less water, and it will be more expensive.
On the other hand, the IPCC projects increases of 5-20% in crop yields in the first decades of this century. But with increased drought, flood, shrinking water supplies, and heat, farmers will have their hands full, and production in some regions could falter or fail. A 2008 report by the U.S. Department of Agriculture predicts grain and oilseed crops will likely grow faster, but the crops will be more prone to failure if climate variability increases and precipitation becomes less dependable. Additionally, invasive weeds tend to grow faster than most cash crops with higher CO2, and some herbicides will be less effective.
And ironically, with higher temperatures comes an increased potential for killing freezes. This is because plants start growing earlier, making them more vulnerable to sudden spring-time cold spells. The consequences of this will likely be felt in the produce aisles. An April 2007 frost that followed a week of warm weather caused more than $2 billion in agricultural losses in the central and southeastern U.S.
Security
Even national security is in the crosshairs of climate change. The U.S. military and intelligence communities have recognized climate change is a "threat multiplier." It increases competition for scarce resources, worsens conditions that cause governments to fail, and produces breeding grounds for extremism and terrorism.
"National Security and the Threat of Climate Change"
2007, CNA Corporation
"Climate Change and National Security"
2007, Council on Foreign Relations
"Global Climate Change: National Security Implications"
2008, U.S. Army War College
"National Intelligence Assessment on the National Security Implications of Global Climate Change to 2030"
2008, Deputy Director of National Intelligence for Analysis
Regional Impacts
Click on the yellow circles in the image below to view the regional impacts due to climate change.
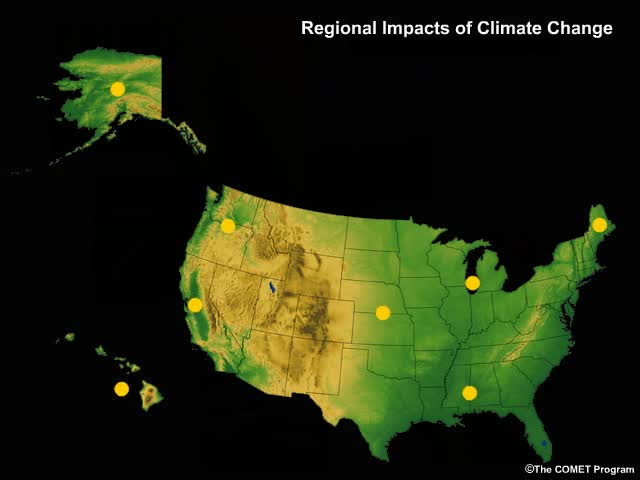
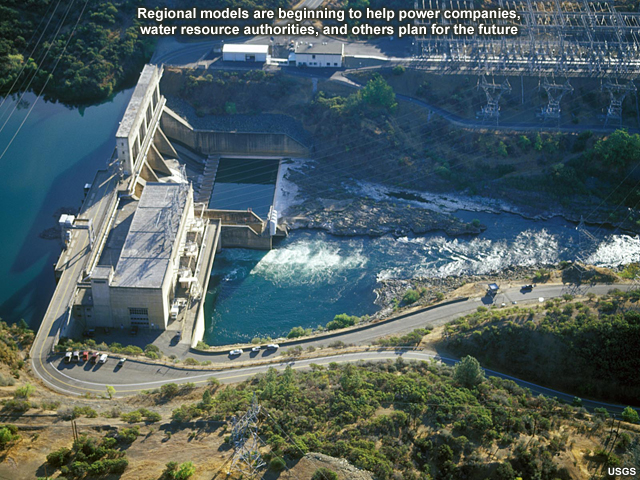
Although the field of regional climate modeling is still maturing, it can take governments years to approve, fund, and implement adaption and mitigation measures. With no solid worldwide plans to reduce human emissions of greenhouse gases in the near future, many U.S. regions and states have begun to use the best information currently available from climate science as inputs for assessments of likely impacts and strategies for dealing with them.
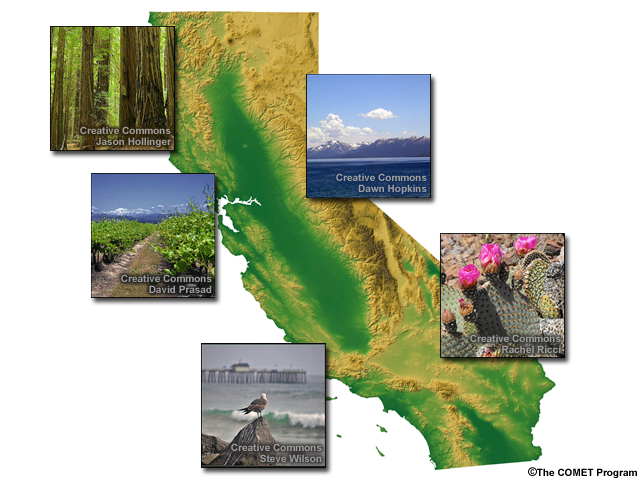
For example, the Second California Assessment (issued in 2011) used downscaled climate and sea-level rise scenarios from six global climate models run with two different greenhouse gas emissions scenarios. The models provided projections of warming, precipitation, and sea-level rise.
The model results were then given to experts from other fields who performed their own modeling and analyses to assess climate change impacts on various California sectors, such as water resources, agriculture, wildfires, public health, and energy. These experts also provided some guidance about possible strategies to reduce adverse impacts.
Of course, climate change impacts will vary from one location to another. Below are some of the more likely effects that U.S. regions can expect in the next century. All areas of the U.S. are expected to have higher summer temperatures, which can cause an Increase in heat-related illness and death, especially in urban areas. On the other hand, winter cold stresses will likely be reduced.
Northeast:
- Coastal erosion, loss of wetlands, and increased damage to roads and utilities from storm surges increased by sea-level rise
- Reduced winter recreation; increased summer recreation
- Increased ice storms
- Northward shifts in the ranges of plants and animals
- Air quality degradation
- More frequent severe flooding
- Lobster and cod fisheries reduced
Southeast and Gulf Coast:
- Increased coastal erosion, reductions in barrier islands and wetlands
- Increased coastal flooding from sea-level rise, storm surge, and heavy rain events
- Increased forest fires and insect outbreaks
- Decreased water availability
- Worsening storm surge impacts
- Major disruptions to ecosystems
Midwest and Great Lakes:
- Lower lake and rivers levels, affecting recreation, shipping, hydropower
- Reduced fish stocks due to warmer waters
- Worsening water quality as habitats are lost and undesirable organisms, such as algae, multiply
- Increased agricultural productivity
- Crop, livestock, and forest management practices must adapt to changes
Great Plains:
- Better farm yields in some areas
- Agricultural productivity shifts northward as drought potential increases
- Intensified spring floods
- Declining water resources
West:
- Possibly intensified winter precipitation
- Earlier snowmelt and reduced snowpack, reducing levels in some reservoirs
- Increasing competition for scarce water supplies
- Increased flooding
- Reduced winter activities
- Decreased yields of crops that are already near climate thresholds such as California wine grapes
- Less groundwater recharge
- Increased wildfire potential
Northwest:
- Forests stressed by droughts and high temperatures
- Increased coastal erosion and loss due to sea-level rise
Alaska:
- More pest outbreaks affecting forests; more wildfires
- General increase in plants and animals
- Less sea ice and warming adversely affects habitat for polar bears, marine mammals, and other wildlife, as well as commercial fishing
- Damage to infrastructure from melting permafrost
- Increased opportunities for summer activities
Hawaii:
- Likely sea level rise of 17-25 inches (43-64 centimeters) by 2100
- Possible large precipitation increases, depending on changes in El Niño
- Increased flooding from high surf and floods
- More frequent and intense droughts, with increases in forest fires
- Reduction in fresh water sources
- Potential adverse impacts to plants and animals in the cloud forests