What Changes Climate?
What Changes Climate?
The First Inkling
Around 1900, a respected Swedish scientist named Svante Arrhenius published a series of papers and a book that included a crazy-sounding prediction. He and a colleague were studying the carbon cycle by estimating the changes in carbon dioxide (or CO2) produced by natural processes such as rock weathering, volcanic eruptions, and ocean absorption.
He also looked at a source no one had thought of before—humans. Was it possible that humans could change the climate? Arrhenius took his colleague's calculations of carbon emissions from human activities and crunched the numbers.
When atmospheric carbon doubled, he figured, it would be enough to raise Earth's temperature 9-11°F (5-6°C), but it would take thousands of years to do it at 1896 rates. By the time his book on the subject was published in 1908, so much more coal was being burned, Arrhenius revised his estimate to centuries. But he reasoned that a warmer climate would be a GOOD thing—understandable, perhaps, given his home in Stockholm, a few hundred miles shy of the Arctic Circle.
Although Arrhenius went on to win the Nobel Prize for Chemistry in 1903, his carbon calculations faded into obscurity. In the hundred years since Arrhenius made his estimate—remarkably close to today's best figure—scientists hotly debated the causes of past and current climate change. However today, most climate scientists agree that multiple lines of evidence clearly show that human-induced climate change is taking place.
Natural Factors
Earth's climate shifts over time because so many different land, ocean, and space phenomena have a hand in it. The sun is the main driver of Earth's climate, as it provides most of the energy. The sun's energy output increased about a tenth of a percent from 1750 to 1950, which contributed about 0.2°F (0.1°C) warming in the first part of the 20th century. But since 1979, when we began taking measurements from space, the data show no long-term change in total solar energy, even though Earth has been warming.
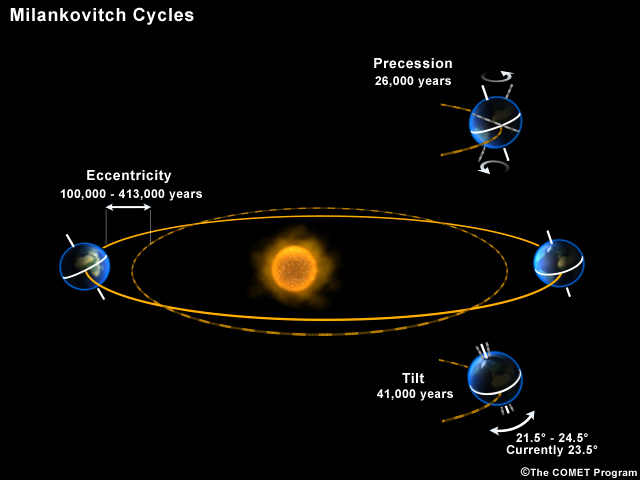
Repetitive cycles in Earth's orbit can influence the angle and timing of sunlight. The tilt and wobble of Earth's axis and the degree to which its orbit is stretched produce the Milankovitch cycles, which scientists believe triggered and shut off ice ages for the last few million years. But these changes take thousands of years, and so cannot explain the warming in this century.
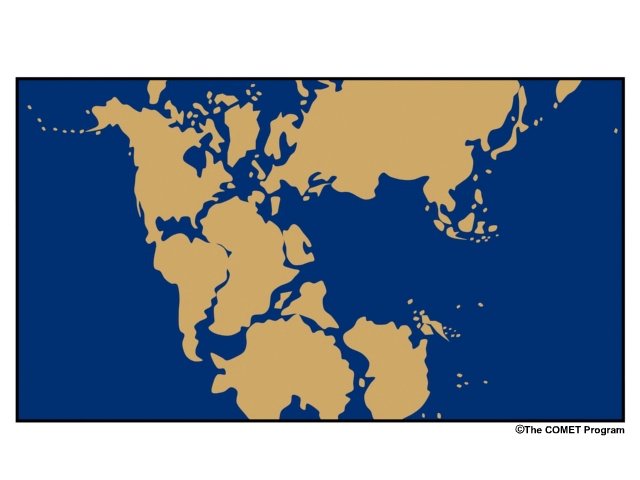
Click to open a drifting continents & ocean currents animation.
Drifting continents make a big difference in climate over millions of years by changing ice caps at the poles and by steering ocean currents, which transport heat and cold throughout the ocean depths. These currents in turn influence atmospheric processes. Snow and ice on Earth also affect climate because they reflect more solar energy than darker land cover or open water.
Huge volcanic eruptions can cool Earth by injecting ash and tiny particles into the stratosphere. The resulting haze shades the sun for a year or two after each major blast. Dust and tiny particles thrown into the air by both natural processes and human activities can have a similar effect, although some absorb sunlight and help heat the climate.
Greenhouse gases, which occur both naturally and as a result of human activities, also influence Earth's climate.
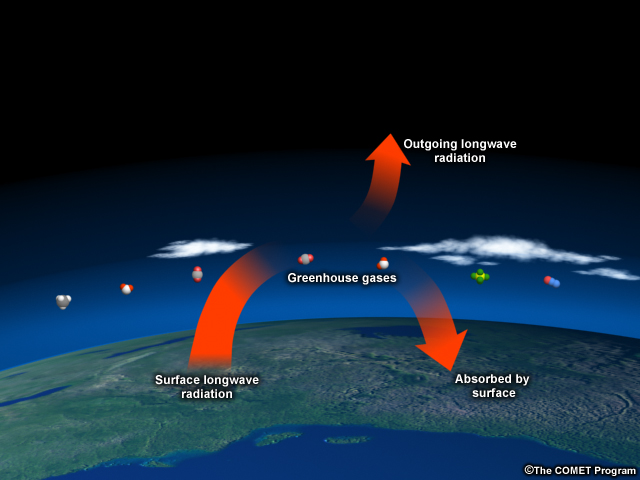
Greenhouse Effect
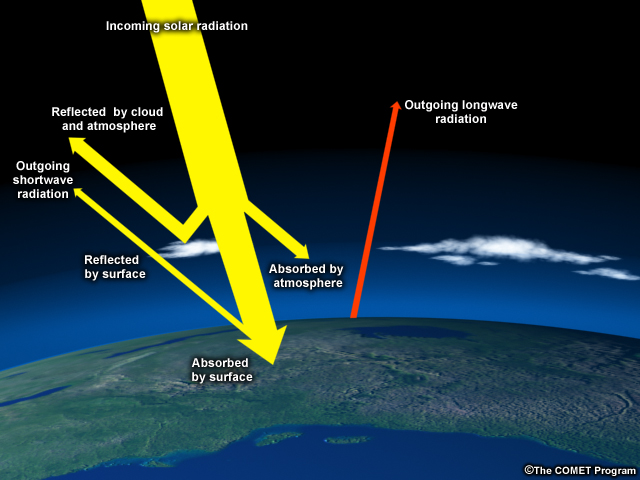
Earth's surface absorbs heat from the sun and then re-radiates it back into the atmosphere and to space.
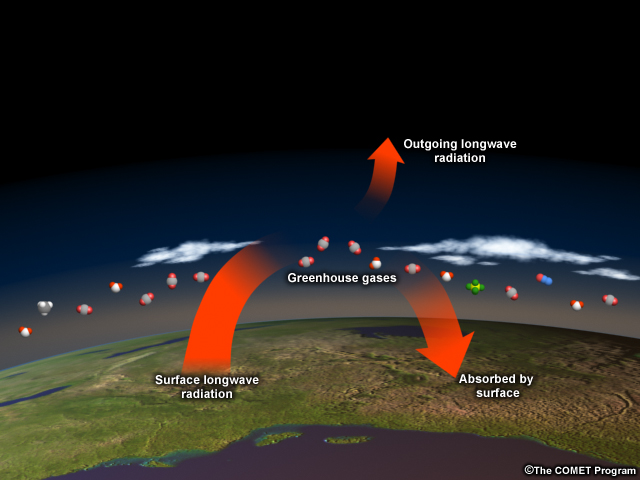
Much of this heat is absorbed by greenhouse gases, which then send the heat back to the surface, to other greenhouse gas molecules, or out to space. This is commonly called "the Greenhouse Effect" but "the blanket effect" may be more appropriate. Though only 1% of atmospheric gases are greenhouse gases, they are extremely powerful heat trappers. By burning fossil fuels faster and faster, humans are effectively piling on more blankets, heating the planet so much and so quickly that it's hard for Mother Nature and human societies to adapt.
Though carbon dioxide gets the most press, it's certainly not the only greenhouse gas, nor even the most powerful. However, humans produce more of it than any other greenhouse gas, and it's very long-lasting (50-100+ years). In the United States, CO2 comprises more than 80% of total greenhouse gas emissions.
Example of Human-Produced Greenhouse Gases | ||||
| Global Warming Potential (Relative to CO2) | ||||
| Species | Lifetime (years) | 20 years | 100 years | 500 years |
| Methane | 12+/- 3 | 56 | 21 | 6.5 |
| Nitrous Oxide | 120 | 280 | 310 | 170 |
| Sulfur hexafluoride | 3,200 | 16,300 | 23,900 | 34,900 |
| Carbon tetrafluoride | 50,000 | 4,400 | 6,500 | 10,000 |
The other greenhouse gases are both natural and human-made. The most common are methane, nitrous oxide, ozone, fluorinated gases, and water vapor. Methane, for example, is only about 8% of U.S. greenhouse gas output, but is 21 times more powerful than carbon dioxide per molecule, although it does not stay in the atmosphere as long. It is produced naturally in wetlands, melting permafrost, termites, belching cows, and by human activities, such as fossil fuel production, landfills, and rice cultivation.
Water vapor is by far the most important gas in the natural greenhouse effect, contributing 60% of the effect to carbon dioxide's 26%. Human activities don't directly increase water vapor. Instead, warming produced by other gases, such as CO2, increases evaporation and allows the atmosphere to hold more water vapor. And in fact, satellites have detected an increase in atmospheric moisture over the oceans at a rate of 4% per degree F of warming (7% per degree C) since 1988. This additional water vapor then adds to the warming because water vapor is a greenhouse gas. More water vapor can also produce more clouds, which have a complicated effect of both cooling the atmosphere by reflecting light and warming it by trapping heat below the clouds.
The main factors that determine the effect of greenhouse gases on climate are:
- The amount and rate of greenhouse gas emissions
- The effectiveness of each gas in trapping heat, and
- The length of time each gas stays in the atmosphere (for example, CO2 lingers in the atmosphere for hundreds of years)
Other greenhouse gases like water vapor are more powerful on a molecule for molecule basis, but the flood of manmade carbon dioxide emissions into the atmosphere this century and its atmospheric staying power are why carbon dioxide is the focus of concerns.
The Carbon Cycle
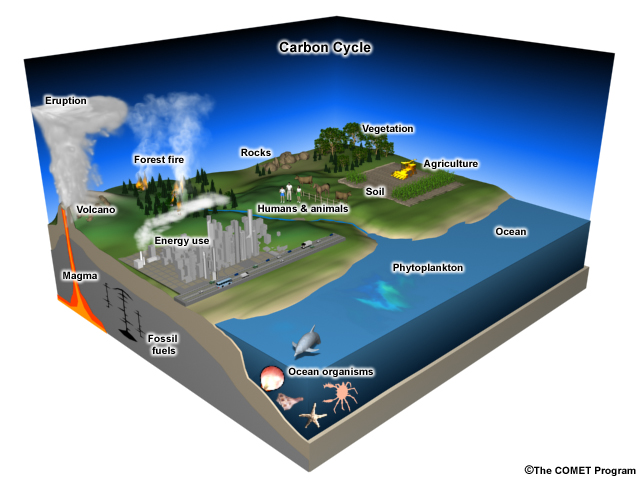
Carbon dioxide isn't stuck in the atmosphere once it gets there. It moves into and out of living organisms, soil, rock, and water. For example, plants take up carbon dioxide in the air to make wood, stems, and leaves, and then release it back into the air when the leaves fall or the plants die. Forest fires release large amounts of CO2, providing an important reason to preserve forests. Animals, including humans, take up carbon when they eat plants, and then release CO2 back into the atmosphere via respiration.
Over very long time frames, the weathering of rocks can add carbon to surface waters that run into the ocean. Eventually, this carbon is removed from the water and forms limestone. It can later be released back into the atmosphere from volcanoes when the rock is melted.
In ancient times when Earth had a much warmer climate, huge swamps buried plant material faster than it could decay, and when the buried remains were subjected to heat and pressure, they became coal. In similar ways, microorganisms buried on lake and sea bottoms throughout Earth's history produced oil. These processes locked up lots of carbon as oil, gas, and coal. By burning these fuels in the last 150 years, we have suddenly released into the atmosphere carbon that took hundreds of millions of years to store.
Past Climates
Certainly, temperatures in Earth's past have been higher (and lower) than today, and
CO2 concentrations have varied considerably. At certain times, changes in the Earth's orbit caused warmer temperatures, which increased CO2 and produced additional warming in a feedback process. But today, the CO2 released by human activities is triggering the increase in temperatures.
What Do You Think?
Question
How does the 2008 concentration of CO2 compare to the highest concentration observed during the last 800,000 years?
The correct answer is a).
The average 2008 CO2 concentration recorded at Mauna Loa, Hawaii was 385.3 ppm. Compare that to the high value of 300 ppm found in the 800,000-year long ice core record. Not only is today's concentration higher, the increase is occurring much faster (over about a century) than past CO2 spikes, which generally happened over several thousand years.
What makes all this worrisome is that we are pushing the system out of the range human civilization has adapted to. The last time the poles were this warm was about 125,000 years ago during the last period between ice ages. The warming we saw in the 20th century happened 10 times faster than the climb out of the last ice age.
Natural Variability
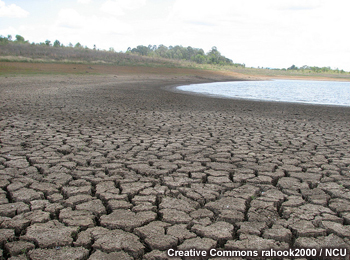
Weather varies naturally because of many factors, and those factors can combine to produce an extreme drought or a devastating flood, stronger hurricanes or record snowfalls. Extremes in weather are nothing new.
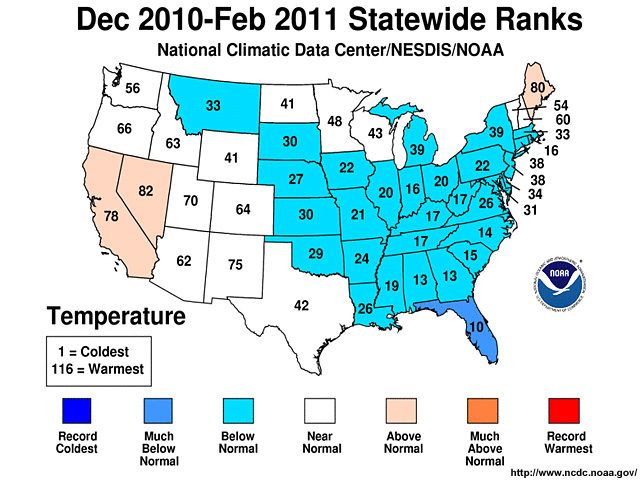
Sometimes, the same general climate pattern can produce drastically different weather conditions in different locations or different years. For example, the unusually cold winter of 2010-2011 in the contiguous U.S. was influenced by a La Niña pattern—a quasi-cyclic cooling of the eastern tropical Pacific Ocean.

It is very likely that this pattern contributed to an unusually cold spring with heavy precipitation in the Upper Missouri River Basin. Heavy rains in May fell on deep late-spring snow pack, which caused flooding that devastated parts of several states.
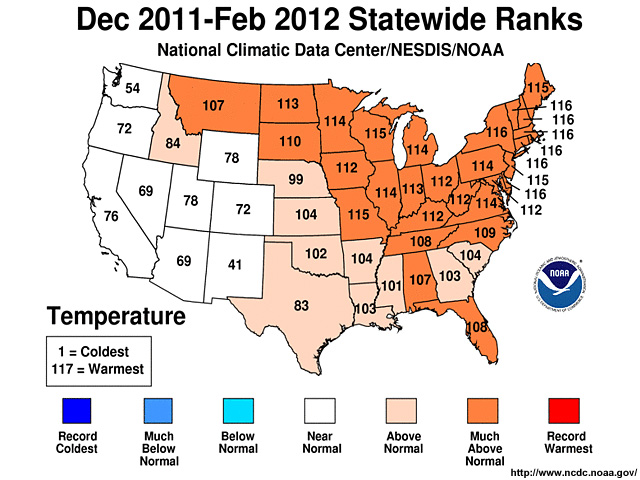
No two El Niño/La Niña-Southern Oscillation events are alike, however. The La Niña pattern persisted through the winter of 2011-2012, although it was somewhat weaker. Surprisingly, that winter was one of the warmest on record in the U.S. A number of factors conspired to produce the two dramatically different results. Part of the difference related to the high latitude pressure patterns (called the Arctic Oscillation) that dominated in the two winters. In the warmer 2011-2012 winter, the pattern tended to trap the cold air near the poles, but why that was the case is still being studied.
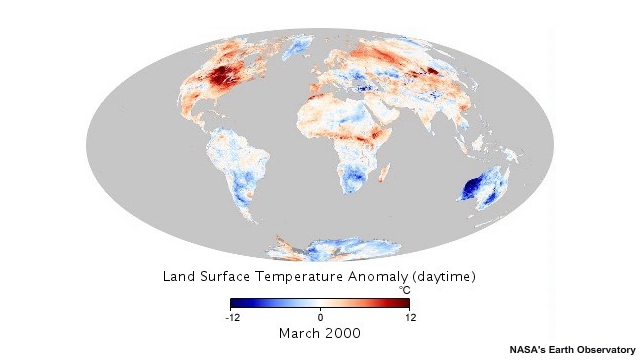
Click to open a land surface temperature anomaly animation.
We have a good understanding that natural modes of climate variability affect the probability and intensity of weather extremes. So how does global warming come into the mix? In some cases it can mitigate extremes. For example, a record cold winter might be a little less cold than it otherwise would have been. However, climate change could also amplify the effects of a natural cycle, producing more severe extremes. So, for example, a natural pattern that produces warmer-than-normal annual conditions could be enhanced by global warming and result in increased night-time temperatures and more frequent heat waves.
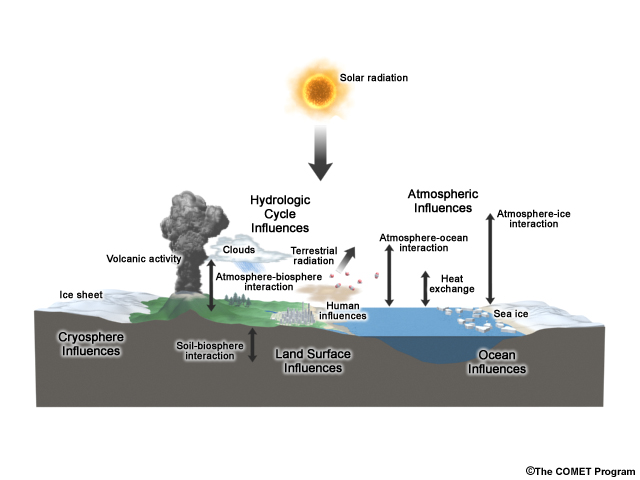
Climate is determined by a complicated interplay of many factors that affect the oceans, land surfaces, and the atmosphere. A change in one of them—such as increasing atmospheric concentrations of greenhouse gases—can ripple throughout the system.